60 minutes
JavaScriptCore Internals Part II: The LLInt and Baseline JIT
Introduction
Historically, the LLInt and Baseline JIT haven’t been the source for may publicly disclosed security related bugs in JavaScriptCore but there are a few reasons why it felt necessary to dedicate an entire post solely to the LLInt and Baseline JIT. The main goal of this post and the blog series is to help researchers navigate the code base and to help speed up the analysis process when triaging bugs/crashes. Understanding how the LLInt and Baseline JIT work and the various components that aid in the functioning of these two tier will help speed up this analysis by helping one finding their bearings within the code base and narrowing the search space being able to skip over components that don’t impact the bug/crash. The second reason to review these two tiers is to gain an appreciation for how code generation and execution flow is achieved for unoptimised bytecode. The design principles used by the LLInt and Baseline JIT are shared across the higher tiers and gaining an understanding of these principles makes for a gentle learning curve when exploring the DFG and FTL.
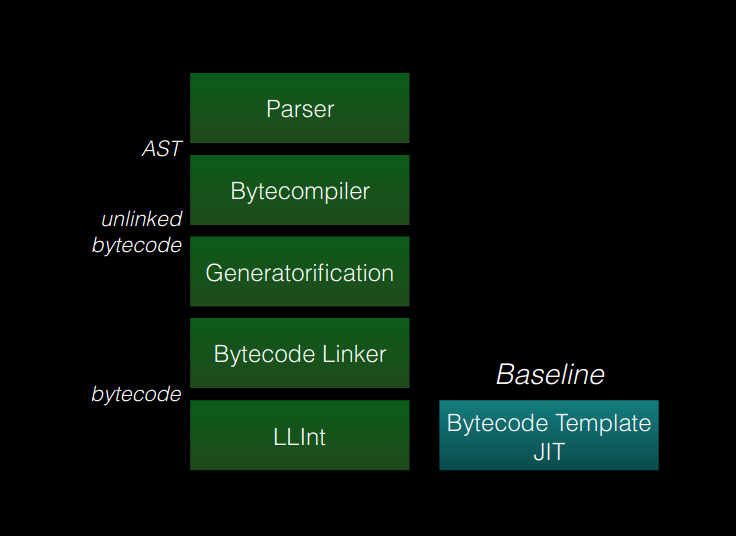
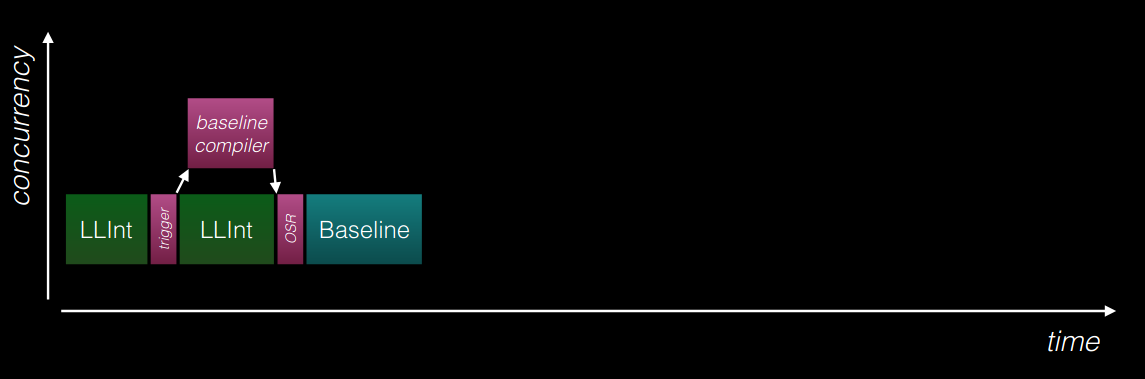
Part I of this blog series traced the journey from source code to bytecode and concluded by briefly discussing how bytecodes are passed to the LLInt and how the LLInt initiates execution. This post dives into the details on how bytecode is executed in the LLInt and how the Baseline JIT is invoked to optimise the bytecode. These are the first two tiers in JavaScriptCore and the stages of the execution pipeline that will be explored are shown in the slide1 reproduced below:
This blog post begins by exploring how the LLInt is constructed using a custom assembly called offlineasm and how one can debug and trace bytecode execution in this custom assembly. It also covers the working of the Baseline JIT and demonstrates how the LLInt determines when bytecode being executed is hot code and should be compiled and executed by the Baseline JIT. The LLInt and Baseline JIT are considered as profiling tiers and this post concludes with a quick introduction on the various profiling sources that the two tiers use. Part III dives into the internals of the Data Flow Graph (DFG) and how bytecode is optimised and generated by this JIT compiler.
Existing Work
In addition to the resources mentioned in Part I, there are a couple of resources from that discuss several aspects of JavaScript code optimisation techniques, some of which will be covered in this post and posts that will follow.
The WebKit blog: Speculation in JavaScriptCore is a magnum opus by Filip Pizlo that goes into the great detail of how speculative compilation is performed in JavaScriptCore and is a fantastic complementary resource to this blog series. The key areas that the WebKit blog discusses which will be relevant to our discussion here are the sections on Control and Profiling.
Another useful resource that will come in handy as you debug and trace the LLInt and Baseline JIT is the WebKit blog JavaScriptCore CSI: A Crash Site Investigation Story. This is also a good resource to get you started with debugging WebKit/JavaScriptCore crashes.
LLInt
This section beings by introducing the LLInt and the custom assembly that is used to construct the LLInt. The LLInt was first introduced in WebKit back in 2012 with the following revision. The revision comment below states the intent of why the LLInt was introduced.
Implemented an interpreter that uses the JIT’s calling convention. This interpreter is called LLInt, or the Low Level Interpreter. JSC will now will start by executing code in LLInt and will only tier up to the old JIT after the code is proven hot.
LLInt is written in a modified form of our macro assembly. This new macro assembly is compiled by an offline assembler (see offlineasm), which implements many modern conveniences such as a Turing-complete CPS-based macro language and direct access to relevant C++ type information (basically offsets of fields and sizes of structs/classes).
Code executing in LLInt appears to the rest of the JSC world “as if” it were executing in the old JIT. Hence, things like exception handling and cross-execution-engine calls just work and require pretty much no additional overhead.
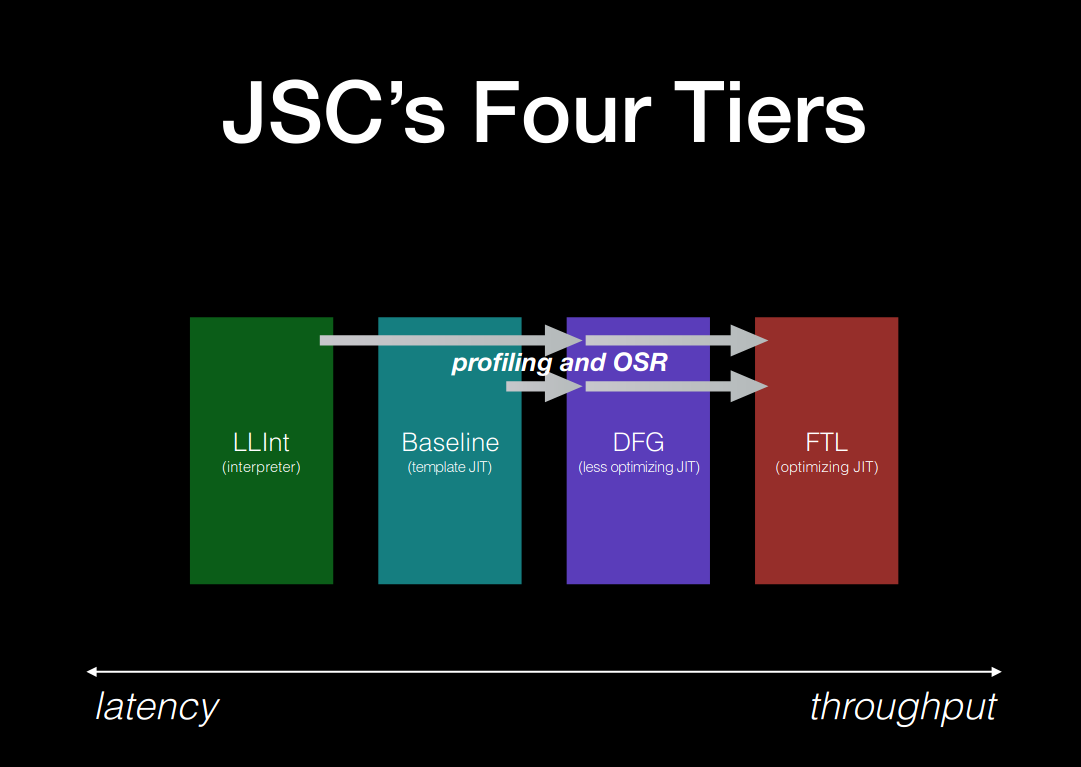
Essentially the LLInt loops over bytecodes and executes each bytecode based on what it’s supposed to do and then moves onto the next bytecode instruction. In addition to bytecode execution, it also gathers profiling information about the bytecodes being executed and maintains counters that measure how often code was executed. Both these parameters (i.e. profiling data and execution counts) are crucial in aiding code optimisation and tiering up to the various JIT tiers via a technique called OSR (On Stack Replacement). The screenshot2 below describes the Four JIT tiers and profiling data and OSRs propagate through the engine.
The source code to the LLInt is located at JavaScriptCore/llint and the starting point to this post’s investigation will be the LLIntEntrypoint.h which is also the first instance where the LLInt was first encountered in Part I.
Recap
Lets pick up from where Part I left off in Interpreter::executeProgram.
CodeBlock* tempCodeBlock;
Exception* error = program->prepareForExecution<ProgramExecutable>(vm, nullptr, scope, CodeForCall, tempCodeBlock);
The pointer to the program object which has a reference to the CodeBlock that now contains linked bytecode. The call to prepareForExecution through a series of calls ends up calling setProgramEntrypoint(CodeBlock* codeBlock). This function as the name suggests is responsible for setting up the entry point into the LLInt to being executing bytecode. The call stack at this point should look similar to the one below:
libJavaScriptCore.so.1!JSC::LLInt::setProgramEntrypoint(JSC::CodeBlock * codeBlock) (/home/amar/workspace/WebKit/Source/JavaScriptCore/llint/LLIntEntrypoint.cpp:112)
libJavaScriptCore.so.1!JSC::LLInt::setEntrypoint(JSC::CodeBlock * codeBlock) (/home/amar/workspace/WebKit/Source/JavaScriptCore/llint/LLIntEntrypoint.cpp:161)
libJavaScriptCore.so.1!JSC::setupLLInt(JSC::CodeBlock * codeBlock) (/home/amar/workspace/WebKit/Source/JavaScriptCore/runtime/ScriptExecutable.cpp:395)
libJavaScriptCore.so.1!JSC::ScriptExecutable::prepareForExecutionImpl(JSC::ScriptExecutable * const this, JSC::VM & vm, JSC::JSFunction * function, JSC::JSScope * scope, JSC::CodeSpecializationKind kind, JSC::CodeBlock *& resultCodeBlock) (/home/amar/workspace/WebKit/Source/JavaScriptCore/runtime/ScriptExecutable.cpp:432)
libJavaScriptCore.so.1!JSC::ScriptExecutable::prepareForExecution<JSC::ProgramExecutable>(JSC::ScriptExecutable * const this, JSC::VM & vm, JSC::JSFunction * function, JSC::JSScope * scope, JSC::CodeSpecializationKind kind, JSC::CodeBlock *& resultCodeBlock) (/home/amar/workspace/WebKit/Source/JavaScriptCore/bytecode/CodeBlock.h:1086)
libJavaScriptCore.so.1!JSC::Interpreter::executeProgram(JSC::Interpreter * const this, const JSC::SourceCode & source, JSC::JSObject * thisObj) (/home/amar/workspace/WebKit/Source/JavaScriptCore/interpreter/Interpreter.cpp:816)
...
Within the function setProgramEntrypoint exists a call to getCodeRef which attempts to get a reference pointer to the executable address for opcode llint_program_prologue. This this reference pointer is where the interpreter (LLInt) beings execution for the CodeBlock.
ALWAYS_INLINE MacroAssemblerCodeRef<tag> getCodeRef(OpcodeID opcodeID)
{
    return MacroAssemblerCodeRef<tag>::createSelfManagedCodeRef(getCodePtr<tag>(opcodeID));
}
Once a reference pointer to llint_program_prologue has been retrieved, a NativeJITCode object is created which stores this code pointer and then initialises the codeBlock with a reference to the NativeJITCode object.
std::call_once(onceKey, [&] {
        jitCode = new NativeJITCode(getCodeRef<JSEntryPtrTag>(llint_program_prologue), JITType::InterpreterThunk, Intrinsic::NoIntrinsic, JITCode::ShareAttribute::Shared);
    });
codeBlock->setJITCode(makeRef(*jitCode));
Finally, the linked bytecode is ready to execute with a call to JITCode::execute. The function is as follows:
ALWAYS_INLINE JSValue JITCode::execute(VM* vm, ProtoCallFrame* protoCallFrame)
{
    //... code truncated for brevity

    void* entryAddress;
    entryAddress = addressForCall(MustCheckArity).executableAddress();
    JSValue result = JSValue::decode(vmEntryToJavaScript(entryAddress, vm, protoCallFrame));
    return scope.exception() ? jsNull() : result;
}
The key function in the snippet above is vmEntryToJavaScript which is a thunk defined in the LowLevelInterpreter.asm. The WebKit blog JavaScriptCore CSI: A Crash Site Investigation Story describes the thunk as follows:
vmEntryToJavaScript is implemented in LLInt assembly using the doVMEntry macro (see LowLevelInterpreter.asm and LowLevelInterpreter64.asm). The JavaScript VM enters all LLInt or JIT code via doVMEntry, and it will exit either via the end of doVMEntry (for normal returns), or via _handleUncaughtException (for exits due to uncaught exceptions).
At this point, execution transfers to the LLInt which now has a reference to the CodeBlock and entryAddress to begin execution from.
Implementation
Before proceeding any further into the details of vmEntryToJavaScript and doVMEntry, it will be worth the readers time to understand the custom assembly that the LLInt is written in. The LLInt is generated using what is referred to as offlineasm assembly. offlineasm is written in Ruby and can be found under JavaScriptCore/offlineasm. The LLInt itself is defined in LowLevelInterpreter.asm and LowLevelInterpreter64.asm.
The machine code generated that forms part of the LLInt is located in LLIntAssembly.h which can be found under the <webkit-folder>/WebKitBuild/Debug/DerivedSources/JavaScriptCore/ directory. This header file is generated at compile time by invoking offlineasm/asm.rb. This build step is listed in JavaSctipCore/CMakeLists.txt:
# The build system will execute asm.rb every time LLIntOffsetsExtractor's mtime is newer than
# LLIntAssembly.h's mtime. The problem we have here is: asm.rb has some built-in optimization
# that generates a checksum of the LLIntOffsetsExtractor binary, if the checksum of the new
# LLIntOffsetsExtractor matches, no output is generated. To make this target consistent and avoid
# running this command for every build, we artificially update LLIntAssembly.h's mtime (using touch)
# after every asm.rb run.
if (MSVC AND NOT ENABLE_C_LOOP)
    #... truncated for brevity
else ()
    set(LLIntOutput LLIntAssembly.h)
endif ()

add_custom_command(
    OUTPUT ${JavaScriptCore_DERIVED_SOURCES_DIR}/${LLIntOutput}
    MAIN_DEPENDENCY ${JSCCORE_DIR}/offlineasm/asm.rb
    DEPENDS LLIntOffsetsExtractor ${LLINT_ASM} ${OFFLINE_ASM} ${JavaScriptCore_DERIVED_SOURCES_DIR}/InitBytecodes.asm ${JavaScriptCore_DERIVED_SOURCES_DIR}/InitWasm.asm
    COMMAND ${CMAKE_COMMAND} -E env CMAKE_CXX_COMPILER_ID=${CMAKE_CXX_COMPILER_ID} GCC_OFFLINEASM_SOURCE_MAP=${GCC_OFFLINEASM_SOURCE_MAP} ${RUBY_EXECUTABLE} ${JAVASCRIPTCORE_DIR}/offlineasm/asm.rb -I${JavaScriptCore_DERIVED_SOURCES_DIR}/ ${JAVASCRIPTCORE_DIR}/llint/LowLevelInterpreter.asm $<TARGET_FILE:LLIntOffsetsExtractor> ${JavaScriptCore_DERIVED_SOURCES_DIR}/${LLIntOutput} ${OFFLINE_ASM_ARGS}
    COMMAND ${CMAKE_COMMAND} -E touch_nocreate ${JavaScriptCore_DERIVED_SOURCES_DIR}/${LLIntOutput}
    WORKING_DIRECTORY ${JavaScriptCore_DERIVED_SOURCES_DIR}
    VERBATIM)

# The explanation for not making LLIntAssembly.h part of the OBJECT_DEPENDS property of some of
# the .cpp files below is similar to the one in the previous comment. However, since these .cpp
# files are used to build JavaScriptCore itself, we can just add LLIntAssembly.h to JavaScript_HEADERS
# since it is used in the add_library() call at the end of this file.
if (MSVC AND NOT ENABLE_C_LOOP)
    #... truncated for brevity
else ()
    # As there's poor toolchain support for using `.file` directives in
    # inline asm (i.e. there's no way to avoid clashes with the `.file`
    # directives generated by the C code in the compilation unit), we
    # introduce a postprocessing pass for the asm that gets assembled into
    # an object file. We only need to do this for LowLevelInterpreter.cpp
    # and cmake doesn't allow us to introduce a compiler wrapper for a
    # single source file, so we need to create a separate target for it.
    add_library(LowLevelInterpreterLib OBJECT llint/LowLevelInterpreter.cpp
        ${JavaScriptCore_DERIVED_SOURCES_DIR}/${LLIntOutput})
endif ()
As the snippet above indicates, this generated header file is included in llint/LowLeveInterpreter.cpp which embeds the interpreter into JavaScriptCore.
// This works around a bug in GDB where, if the compilation unit
// doesn't have any address range information, its line table won't
// even be consulted. Emit {before,after}_llint_asm so that the code
// emitted in the top level inline asm statement is within functions
// visible to the compiler. This way, GDB can resolve a PC in the
// llint asm code to this compilation unit and the successfully look
// up the line number information.
DEBUGGER_ANNOTATION_MARKER(before_llint_asm)

// This is a file generated by offlineasm, which contains all of the assembly code
// for the interpreter, as compiled from LowLevelInterpreter.asm.
#include "LLIntAssembly.h"

DEBUGGER_ANNOTATION_MARKER(after_llint_asm)
The offlineasm compilation at a high-level functions as follows:
- asm.rb is invoked by supplying LowLevelInterpreter.asm and a target backend (i.e. cpu architecture) as input.
- The .asm files are lexed and parsed by the offlineasm parser defined in parser.rb
- Successful parsing generates an Abstract Syntax Tree (AST), the schema for which is defined in ast.rb
- The generated AST is then transformed (see tranform.rb) before it is lowered to the target backend.
- The nodes of the transformed AST are then traversed and machine code is emitted for each node. The machine code to be emitted for the different target backends is defined in its own ruby file. For example, the machine code for x86 is defined in x86.rb.
- The machine code emitted for the target backend is written to LLIntAssembly.h
This process of offlineasm compilation is very similar to the way JavaScriptCore generates bytecodes from supplied javascript source code. In this case however, the machine code is generated from the offlineasm assembly. A list of all offlineasm instruction and registers can be found in instructions.rb and registers.rb respectively. offlineasm supports multiple cpu architectures and these are referred to as backends. The various supported backends are listed in backends.rb.
The reader may be wondering why the LLInt is written in offlineasm rather than C/C++, which is what pretty much the rest of the engine is written in. A good discussion on this matter can be found in the How Profiled Execution Works section of the WebKit blogpost3 and explains the trade offs between using a custom assembly vs C/C++. The blog also describes two key features of offlineasm:
Portable assembly with our own mnemonics and register names that match the way we do portable assembly in our JIT. Some high-level mnemonics require lowering. Offlineasm reserves some scratch registers to use for lowering.
The
macroconstruct. It’s best to think of this as a lambda that takes some arguments and returns void. Then think of the portable assembly statements as print statements that output that assembly. So, the macros are executed for effect and that effect is to produce an assembly program. These are the execution semantics of offlineasm at compile time.
Offlineasm
At this point the reader should now know how the LLInt is implemented and where to find the machine code that’s generated for it. This section discuses the language itself and how to go about reading it. The developer comments at the start of the LowLevelInterpreter.asm provide an introduction to the language and its definitely worth reading. This section will highlight the various constructs of the offlineasm language and provide examples from the codebase.
Macros
Most instructions are grouped as macros, which according to the developer comments are lambda expressions.
A “macro” is a lambda expression, which may be either anonymous or named. But this has caveats. “macro” can take zero or more arguments, which may be macros or any valid operands, but it can only return code. But you can do Turing-complete things via continuation passing style: “macro foo (a, b) b(a, a) end foo(foo, foo)”. Actually, don’t do that, since you’ll just crash the assembler.
The following snippet is an example of the dispatch macro.
macro dispatch(advanceReg)
    addp advanceReg, PC
    nextInstruction()
end
The macro above takes one argument, which in this case is the advanceReg. The macro body contains two instructions, the first is a call of the addp instruction which takes two operands advanceReg and PC. The second is a call to the macro nextInstruction().
Another important aspect to consider about macros is the scoping of arguments. The developer comments has the following to say on this matter:
Arguments to macros follow lexical scoping rather than dynamic scoping. Const’s also follow lexical scoping and may override (hide) arguments or other consts. All variables (arguments and constants) can be bound to operands. Additionally, arguments (but not constants) can be bound to macros.
Macros are not always labeled and can exist as anonymous macros. The snippet below is an example of an anonymous macro being used in llint_program_prologue which is the glue code that allows the LLInt to find the entrypoint to the linked bytecode in the supplied code block:
op(llint_program_prologue, macro ()
    prologue(notFunctionCodeBlockGetter, notFunctionCodeBlockSetter, _llint_entry_osr, _llint_trace_prologue)
    dispatch(0)
end)
Instructions
The instructions in offlineasm generally follow GNU Assembler syntax. The developer comments for instructions are as follows:
Mostly gas-style operand ordering. The last operand tends to be the destination. So “a := b” is written as “mov b, a”. But unlike gas, comparisons are in-order, so “if (a < b)” is written as “bilt a, b, …”.
In the snippet below, the move instruction takes two operands lr and destinationRegister. The value in lr is moved to destinationRegister
move lr, destinationRegister
Some instructions will also contain postfixes which provide additional information on the behaviour of the instruction. The various postfixes that can be added to instructions are documented in the developer comment below:
“b” = byte, “h” = 16-bit word, “i” = 32-bit word, “p” = pointer. For 32-bit, “i” and “p” are interchangeable except when an op supports one but not the other.
In the snippet below, the instruction add which is postfixed with p, indicating this is a pointer addition operation where the value of advanceReg is added to PC.
macro dispatch(advanceReg)
    addp advanceReg, PC
    nextInstruction()
end
Operands
Instructions take one or more operands. A note on operands for instructions and macros from the developer comments is as follows:
In general, valid operands for macro invocations and instructions are registers (eg “t0”), addresses (eg “4[t0]”), base-index addresses (eg “7[t0, t1, 2]”), absolute addresses (eg “0xa0000000[]”), or labels (eg “_foo” or “.foo”). Macro invocations can also take anonymous macros as operands. Instructions cannot take anonymous macros.
The following snippet, shows some of the various operand types in use (i.e. registers, addresses, base-index addresses and labels):
.copyLoop:
    if ARM64 and not ADDRESS64
        subi MachineRegisterSize, temp2
        loadq [sp, temp2, 1], temp3
        storeq temp3, [temp1, temp2, 1]
        btinz temp2, .copyLoop
    else
        subi PtrSize, temp2
        loadp [sp, temp2, 1], temp3
        storep temp3, [temp1, temp2, 1]
        btinz temp2, .copyLoop
    end

    move temp1, sp
    jmp callee, callPtrTag
end
Registers
Some notes on the various registers in use by offlineasm, these have been reproduced from the developer comments.
cfr and sp hold the call frame and (native) stack pointer respectively. They are callee-save registers, and guaranteed to be distinct from all other registers on all architectures.
t0, t1, t2, t3, t4, and optionally t5, t6, and t7 are temporary registers that can get trashed on calls, and are pairwise distinct registers. t4 holds the JS program counter, so use with caution in opcodes (actually, don’t use it in opcodes at all, except as PC).
r0 and r1 are the platform’s customary return registers, and thus are two distinct registers
a0, a1, a2 and a3 are the platform’s customary argument registers, and thus are pairwise distinct registers. Be mindful that:
- On X86, there are no argument registers. a0 and a1 are edx and ecx following the fastcall convention, but you should still use the stack to pass your arguments. The cCall2 and cCall4 macros do this for you.
There are additional assumptions and platform specific details about some of these registers that the reader is welcome to explore.
Labels
Labels are much like goto statements in C/C++ and the developer notes on labels has the following to say:
Labels must have names that begin with either “” or “.”. A “.” label is local and gets renamed before code gen to minimize namespace pollution. A “” label is an extern symbol (i.e. “.globl”). The “” may or may not be removed during code gen depending on whether the asm conventions for C name mangling on the target platform mandate a “” prefix.
The snippet below shows an examples of local labels (i.e. .afterHandlingTraps, .handleTraps, etc) in use:
llintOp(op_check_traps, OpCheckTraps, macro (unused, unused, dispatch)
    loadp CodeBlock[cfr], t1
    loadp CodeBlock::m_vm[t1], t1
    loadb VM::m_traps+VMTraps::m_needTrapHandling[t1], t0
    btpnz t0, .handleTraps
.afterHandlingTraps:
    dispatch()
.handleTraps:
    callTrapHandler(.throwHandler)
    jmp .afterHandlingTraps
.throwHandler:
    jmp _llint_throw_from_slow_path_trampoline
end)
An example of global labels (i.e. “_” labels) is shown in the snippet below:
if C_LOOP or C_LOOP_WIN
    _llint_vm_entry_to_javascript:
else
    global _vmEntryToJavaScript
    _vmEntryToJavaScript:
end
    doVMEntry(makeJavaScriptCall)
Global labels have a global scope and can be referenced anywhere in the assembly whereas Local labels are scoped to a macro and can only be referenced within the macro that defines them.
Conditional Statements
Another interesting construct in the previous snippet is the if statement. The developer comments on if statements are as follows:
An “if” is a conditional on settings. Any identifier supplied in the predicate of an “if” is assumed to be a #define that is available during code gen. So you can’t use “if” for computation in a macro, but you can use it to select different pieces of code for different platforms.
The snippet below shows an example of an if statement
if C_LOOP or C_LOOP_WIN or ARMv7 or ARM64 or ARM64E or MIPS
   # In C_LOOP or C_LOOP_WIN case, we're only preserving the bytecode vPC.
   move lr, destinationRegister
elsif X86 or X86_WIN or X86_64 or X86_64_WIN
    pop destinationRegister
else
    error
end
The predicates within the if statements, i.e. C_LOOP, ARM64, X86, etc are defined in the JavaScriptCore codebase and effectively perform the same function as #ifdef statements in C/C++.
Const Expressions
Const expressions allow offlineasm to define constant values to be used by the assembly or reference values implemented by the JIT ABI. The ABI references are translated to offsets at compile time by the offlineasm interpreter. An example of const declarations is shown in the snippet below:
# These declarations must match interpreter/JSStack.h.

const PtrSize = constexpr (sizeof(void*))
const MachineRegisterSize = constexpr (sizeof(CPURegister))
const SlotSize = constexpr (sizeof(Register))

if JSVALUE64
    const CallFrameHeaderSlots = 5
else
    const CallFrameHeaderSlots = 4
    const CallFrameAlignSlots = 1
end
The values PtrSize, MachineRegisterSize and SlotSize are determined at compile time when the relevant expressions are evaluated. The values of CPUResiter and Register are defined in stdlib.h for the target architecture. The CallFrameHeaderSlots and CallFrameAlignSlots are constant values that are referenced in LowLevelInterpreter.asm.
Tracing Execution
JavaScriptCore allows two commandline flags to enable tracing execution within the LLInt. These are traceLLIntExecution and traceLLIntSlowPath. However, in order to use these flags one would need to enable LLInt tracing in the LLInt configuration. This is achieved by setting LLINT_TRACING in LLIntCommon.h:
// Enables LLINT tracing.
// - Prints every instruction executed if Options::traceLLIntExecution() is enabled.
// - Prints some information for some of the more subtle slow paths if
//   Options::traceLLIntSlowPath() is enabled.
#define LLINT_TRACING 1
The two flags can now be added the run configuration launch.json or on the commandline. Here’s what launch.json should look like:
{
    "version": "0.2.0",
    "configurations": [
        {
            "name": "(gdb) Launch",
            "type": "cppdbg",
            "request": "launch",
            "program": "/home/amar/workspace/WebKit/WebKitBuild/Debug/bin/jsc",
            "args": ["--reportBytecodeCompileTimes=true", "--dumpGeneratedBytecodes=true", "--useJIT=false", "--traceLLIntExecution=true","--traceLLIntSlowPath=true", "/home/amar/workspace/WebKit/WebKitBuild/Debug/bin/test.js"],

//... truncated for brevity

        }
    ]
}
Let’s quickly revisit our test script:
$ cat test.js
let x = 10;
let y = 20;
let z = x + y;
and the bytecodes generated for it:
<global>#AmfQ2h:[0x7fffee3bc000->0x7fffeedcb848, NoneGlobal, 96]: 18 instructions (0 16-bit instructions, 0 32-bit instructions, 11 instructions with metadata); 216 bytes (120 metadata bytes); 1 parameter(s); 12 callee register(s); 6 variable(s); scope at loc4

bb#1
[   0] enter
[   1] get_scope          loc4
[   3] mov                loc5, loc4
[   6] check_traps
[   7] mov                loc6, Undefined(const0)
[  10] resolve_scope      loc7, loc4, 0, GlobalProperty, 0
[  17] put_to_scope       loc7, 0, Int32: 10(const1), 1048576<DoNotThrowIfNotFound|GlobalProperty|Initialization|NotStrictMode>, 0, 0
[  25] resolve_scope      loc7, loc4, 1, GlobalProperty, 0
[  32] put_to_scope       loc7, 1, Int32: 20(const2), 1048576<DoNotThrowIfNotFound|GlobalProperty|Initialization|NotStrictMode>, 0, 0
[  40] resolve_scope      loc7, loc4, 2, GlobalProperty, 0
[  47] resolve_scope      loc8, loc4, 0, GlobalProperty, 0
[  54] get_from_scope     loc9, loc8, 0, 2048<ThrowIfNotFound|GlobalProperty|NotInitialization|NotStrictMode>, 0, 0
[  62] mov                loc8, loc9
[  65] resolve_scope      loc9, loc4, 1, GlobalProperty, 0
[  72] get_from_scope     loc10, loc9, 1, 2048<ThrowIfNotFound|GlobalProperty|NotInitialization|NotStrictMode>, 0, 0
[  80] add                loc8, loc8, loc10, OperandTypes(126, 126)
[  86] put_to_scope       loc7, 2, loc8, 1048576<DoNotThrowIfNotFound|GlobalProperty|Initialization|NotStrictMode>, 0, 0
[  94] end                loc6
Successors: [ ]


Identifiers:
  id0 = x
  id1 = y
  id2 = z

Constants:
   k0 = Undefined
   k1 = Int32: 10: in source as integer
   k2 = Int32: 20: in source as integer
With the LLInt tracing enabled and the --traceLLIntExecution=true flag passed to the jsc shell via the commandline, allows dumping of the execution trace for each bytecode to stdout:
<0x7fffeedff000> 0x7fffee3bc000 / 0x7fffffffcb60: in prologue of <global>#AmfQ2h:[0x7fffee3bc000->0x7fffeedcb848, LLIntGlobal, 96]
<0x7fffeedff000> 0x7fffee3bc000 / 0x7fffffffcb60: executing bc#0, op_enter, pc = 0x7fffeedf49c0
Frame will eventually return to 0x7ffff4e61403
<0x7fffeedff000> 0x7fffee3bc000 / 0x7fffffffcb60: executing bc#1, op_get_scope, pc = 0x7fffeedf49c1
<0x7fffeedff000> 0x7fffee3bc000 / 0x7fffffffcb60: executing bc#3, op_mov, pc = 0x7fffeedf49c3
<0x7fffeedff000> 0x7fffee3bc000 / 0x7fffffffcb60: executing bc#6, op_check_traps, pc = 0x7fffeedf49c6
<0x7fffeedff000> 0x7fffee3bc000 / 0x7fffffffcb60: executing bc#7, op_mov, pc = 0x7fffeedf49c7
<0x7fffeedff000> 0x7fffee3bc000 / 0x7fffffffcb60: executing bc#10, op_resolve_scope, pc = 0x7fffeedf49ca
<0x7fffeedff000> 0x7fffee3bc000 / 0x7fffffffcb60: executing bc#17, op_put_to_scope, pc = 0x7fffeedf49d1
<0x7fffeedff000> 0x7fffee3bc000 / 0x7fffffffcb60: executing bc#25, op_resolve_scope, pc = 0x7fffeedf49d9
<0x7fffeedff000> 0x7fffee3bc000 / 0x7fffffffcb60: executing bc#32, op_put_to_scope, pc = 0x7fffeedf49e0
<0x7fffeedff000> 0x7fffee3bc000 / 0x7fffffffcb60: executing bc#40, op_resolve_scope, pc = 0x7fffeedf49e8
<0x7fffeedff000> 0x7fffee3bc000 / 0x7fffffffcb60: executing bc#47, op_resolve_scope, pc = 0x7fffeedf49ef
<0x7fffeedff000> 0x7fffee3bc000 / 0x7fffffffcb60: executing bc#54, op_get_from_scope, pc = 0x7fffeedf49f6
<0x7fffeedff000> 0x7fffee3bc000 / 0x7fffffffcb60: executing bc#62, op_mov, pc = 0x7fffeedf49fe
<0x7fffeedff000> 0x7fffee3bc000 / 0x7fffffffcb60: executing bc#65, op_resolve_scope, pc = 0x7fffeedf4a01
<0x7fffeedff000> 0x7fffee3bc000 / 0x7fffffffcb60: executing bc#72, op_get_from_scope, pc = 0x7fffeedf4a08
<0x7fffeedff000> 0x7fffee3bc000 / 0x7fffffffcb60: executing bc#80, op_add, pc = 0x7fffeedf4a10
<0x7fffeedff000> 0x7fffee3bc000 / 0x7fffffffcb60: executing bc#86, op_put_to_scope, pc = 0x7fffeedf4a16
<0x7fffeedff000> 0x7fffee3bc000 / 0x7fffffffcb60: executing bc#94, op_end, pc = 0x7fffeedf4a1e
Lets return to our discussion on vmEntryToJavaScript that was left off from in the recap section. As stated previously, this is the entry point into the LLInt. This is defined as a global label within LowLevelInterpreter.asm as follows:
# ... asm truncated for brevity

    global _vmEntryToJavaScript
    _vmEntryToJavaScript:

    doVMEntry(makeJavaScriptCall)
This effectively calls the macro, doVMEntry with the macro makeJavaScriptCall passed as an argument. These two macros are defined in LowLevelInterpreter64.asm.
The macro doVMEntry does a number of actions before it calls the macro makeJavaScriptCall. These actions are setting up the function prologue, saving register state, checking stack pointer alignment, adding a VMEntryRecord and setting up the stack with arguments for the call to makeJavaScriptCall. A truncated assembly snippet is shown below:
macro doVMEntry(makeCall)
    functionPrologue()
    pushCalleeSaves()

    const entry = a0
    const vm = a1
    const protoCallFrame = a2

    vmEntryRecord(cfr, sp)

    checkStackPointerAlignment(t4, 0xbad0dc01)

    //... assembly truncated for brevity

    checkStackPointerAlignment(extraTempReg, 0xbad0dc02)

    makeCall(entry, protoCallFrame, t3, t4)     <-- call to makeJavaScriptCall which initiates bytecode execution

    checkStackPointerAlignment(t2, 0xbad0dc03)

    vmEntryRecord(cfr, t4)

    //... assembly truncated for brevity

    subp cfr, CalleeRegisterSaveSize, sp

    popCalleeSaves()
    functionEpilogue()
    ret

//... assembly truncated for brevity

end
When the call to makeJavaScriptCall returns, it performs actions to once again check stack alignment, update the VMEntryRecord, restore saved registers and invoke the function epilogue macro before returning control to its caller. makeCall in the snippet above invokes makeJavaScriptCall which is defined as follows:
# a0, a2, t3, t4
macro makeJavaScriptCall(entry, protoCallFrame, temp1, temp2)
    addp 16, sp
    //... assembly truncated for brevity
    call entry, JSEntryPtrTag

    subp 16, sp
end
The call parameter entry here refers to the glue code llint_program_prologue that was set during the LLInt setup stage. This glue code is defined in LowLevelInterpreter.asm as follows:
op(llint_program_prologue, macro ()
    prologue(notFunctionCodeBlockGetter, notFunctionCodeBlockSetter, _llint_entry_osr, _llint_trace_prologue)
    dispatch(0)
end)
This glue code when compiled by offlineasm gets emitted in LLIntAssembly.h, a truncated snippet of which is shown below:
OFFLINE_ASM_GLUE_LABEL(llint_program_prologue)
".loc 1 1346\n"
    // /home/amar/workspace/WebKit/Source/JavaScriptCore/llint/LowLevelInterpreter.asm:1346
    // /home/amar/workspace/WebKit/Source/JavaScriptCore/llint/LowLevelInterpreter.asm:777
".loc 1 777\n"
    "\tpush %rbp\n"
".loc 1 783\n"
    "\tmovq %rsp, %rbp\n"                                    // /home/amar/workspace/WebKit/Source/JavaScriptCore/llint/LowLevelInterpreter.asm:783

    //... code truncated for brevity
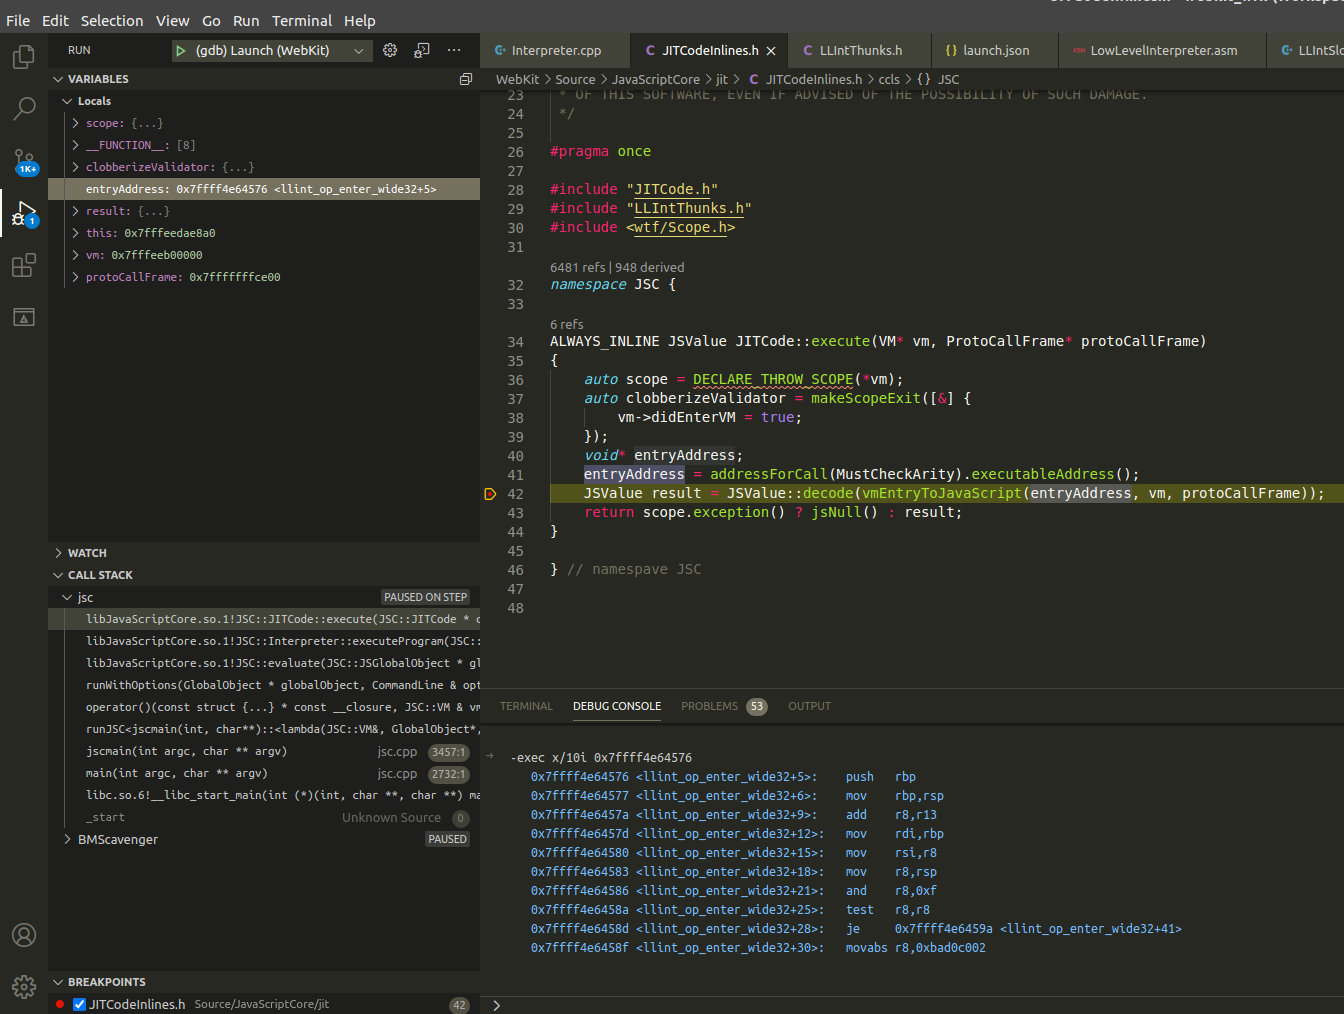
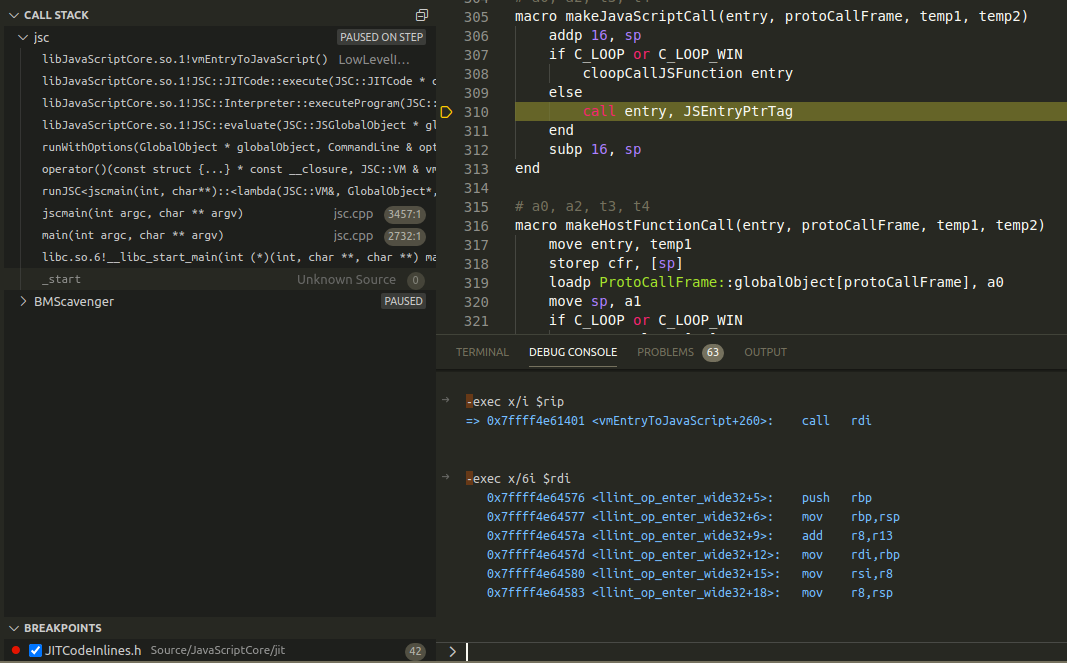
At runtime this resolves to the address of the <llint_op_enter_wide32+5>. This can also be seen by setting a breakpoint within JITCode::execute and inspecting the value at entryAddress. The screenshot below show the the value of entryAddress at runtime and the instruction dump at that address.
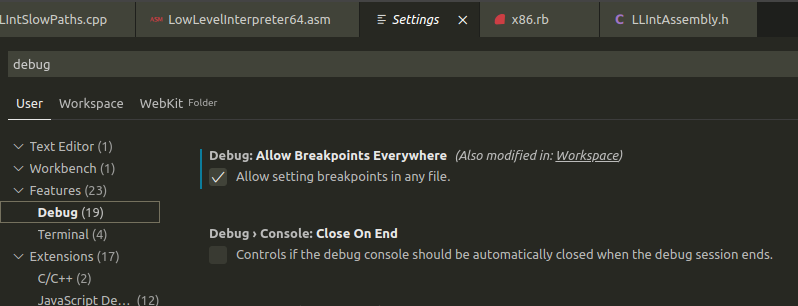
Another handy feature of vscode is enabling the Allow Breakpoints Everywhere setting in vscode. This will allow setting breakpoints directly in LowLevelInterpreter.asm and LowLevelInterpreter64.asm. This will save a bit of time rather than having to set breakpoints in gdb to break in the LLInt.
This would now allow source-level debugging in offlineasm source files. However, this isn’t a foolproof method as vscode is unable to resolve branching instructions that rely on indirect address resolution. A good example of this is the call instruction to entry in makeJavaScriptCall.
call entry, JSEntryPtrTag
the jump address for entry is stored in register rdi and a breakpoint would need to be set manually at the address pointed to by rdi. In the screenshot below, the debugger pauses execution at call entry, JSEntryPtrTag and from within gdb allows listing of the current instruction the debugger is stopped at and the instructions that execution would jump to:
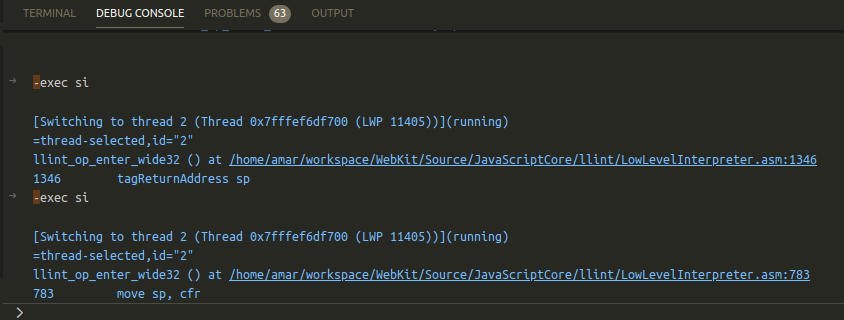
Fortunately, the WebKit developers have added a line table to LLIntAssembly.h, which allows the debugger to cross-reference the LowLevelInterpreter.asm and LowLevelInterpreter64.asm while stepping through instructions in gdb. The screenshot below is an example of what it would look like stepping through llint_op_enter_wide32:
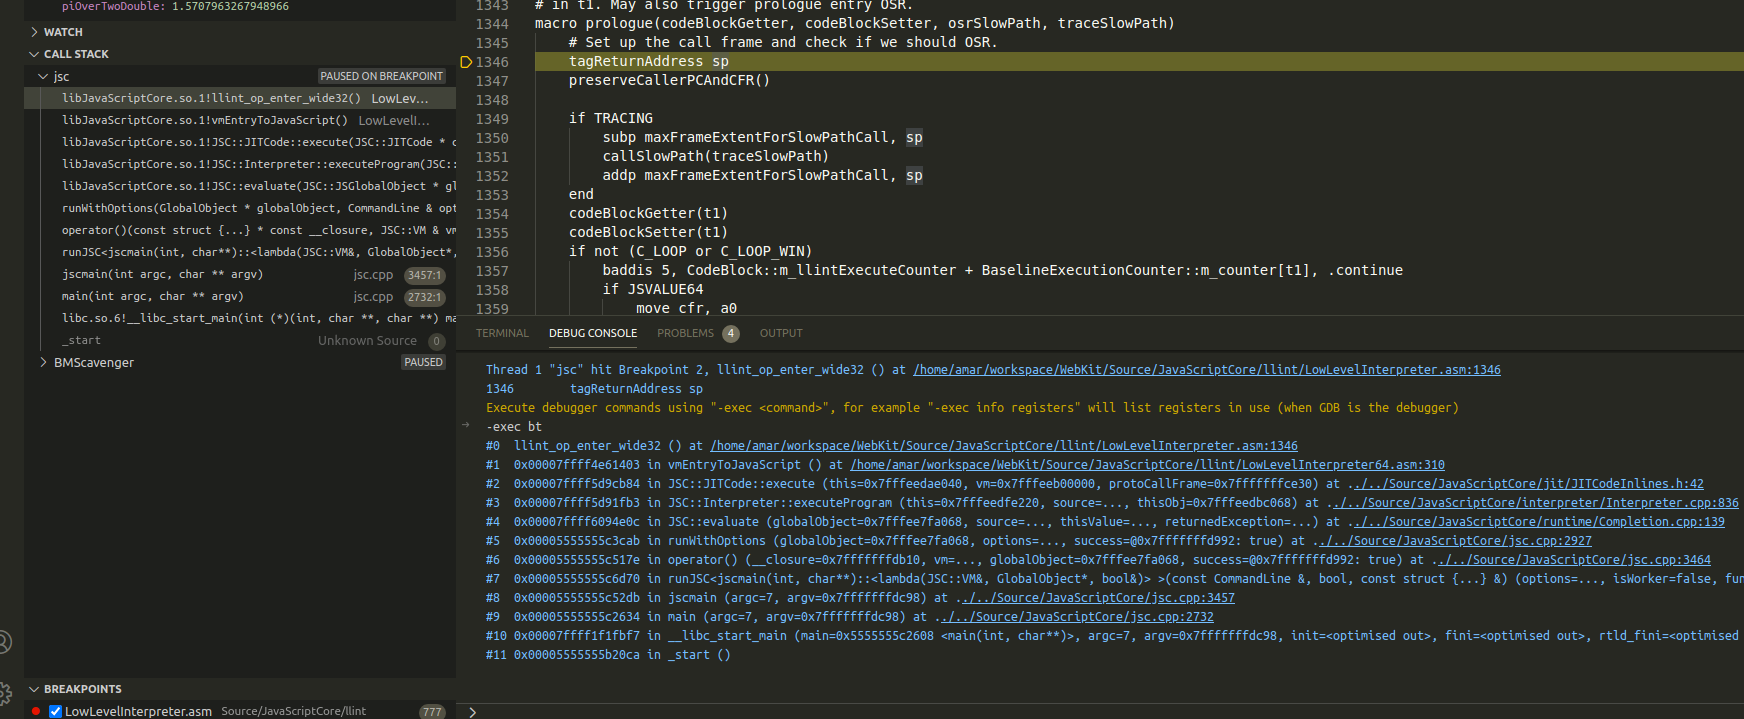
With the locations in the offlineasm source files specified in the line table and the ability to set breakpoints directly at points of interest in the .asm files, one can continue debugging at the sourcecode level. The screenshot below shows an example of what that would look like in vscode:
At this point one should now be able to enable execution tracing in the LLInt and setup breakpoints in offlineasm source files. Also discussed was how the jump to the llint_program_prologue glue code initiates the execution of bytecode.
This section will now discuss the LLInt execution loop which iterates over the bytecodes and executes them sequentially. The high level overview of this execution loop is as follows:
- call
dispatchwith an optional argument that would incrementPC - Increment
PCwith the argument passed todispatch - Lookup the opcode map and fetch the address of the llint opcode label for the corresponding bytecode to be executed
- Jump to the llint opcode label that which is the start of the bytecode instructions to be executed
- Once execution has completed, repeat #1
Let’s look a this loop in more detail by examining the execution of opcode mov which is at bytecode bc#3.
[ 3] mov loc5, loc4
Begin by setting a breakpoint at the start of the opcode macro dispatch definition in LowLevelInterpreter.asm. When the call to dispatch is made, advanceReg contains the value 0x2. PC currently points to bytecode bc#1and this is incremented by adding 0x2 to point to bytecode bc#3 which is the mov bytecode in our bytecode dump.
macro dispatch(advanceReg)
    addp advanceReg, PC
    nextInstruction()
end
with PC incremented and pointing to bc#3, a call to nextInstruction() is made. The macro nextInstruction looks up the _g_opcodeMap to find the opcode implementation in the LLInt. Once the jmp in nextInstruction() is taken, execution controls ends up in the LLInt assembly for llint_op_mov.
macro nextInstruction()
    loadb [PB, PC, 1], t0
    leap _g_opcodeMap, t1
    jmp [t1, t0, PtrSize], BytecodePtrTag
end
The bytecode opcodes are implemented in this section of the LowLevelInterpreter64.asm and are referenced via the llint opcode labels which are defined in LLIntAssembly.h. An example of this is the mov opcode which is referenced by the label op_mov:
llintOpWithReturn(op_mov, OpMov, macro (size, get, dispatch, return)
    get(m_src, t1)
    loadConstantOrVariable(size, t1, t2)
    return(t2)
end)
And the corresponding definition in the LLIntAssembly.h is as follows:
OFFLINE_ASM_OPCODE_LABEL(op_mov)
".loc 3 358\n"
    "\taddq %r13, %r8\n"                                     // /home/amar/workspace/WebKit/Source/JavaScriptCore/llint/LowLevelInterpreter64.asm:358
".loc 3 368\n"
    "\tmovq %rbp, %rdi\n"                                    // /home/amar/workspace/WebKit/Source/JavaScriptCore/llint/LowLevelInterpreter64.asm:368
".loc 3 369\n"
    "\tmovq %r8, %rsi\n"                                     // /home/amar/workspace/WebKit/Source/JavaScriptCore/llint/LowLevelInterpreter64.asm:369
".loc 1 704\n"
    "\tmovq %rsp, %r8\n"                                     // /home/amar/workspace/WebKit/Source/JavaScriptCore/llint/LowLevelInterpreter.asm:704
    "\tandq $15, %r8\n"

//... truncated for brevity

".loc 3 513\n"
    "\tcmpq $16, %rsi\n"                                     // /home/amar/workspace/WebKit/Source/JavaScriptCore/llint/LowLevelInterpreter64.asm:513
    "\tjge " LOCAL_LABEL_STRING(_offlineasm_llintOpWithReturn__llintOp__commonOp__fn__fn__makeReturn__fn__fn__loadConstantOrVariable__size__k__57_load__constant) "\n"
".loc 3 514\n"
    "\tmovq 0(%rbp, %rsi, 8), %rdx\n"                        // /home/amar/workspace/WebKit/Source/JavaScriptCore/llint/LowLevelInterpreter64.asm:514
".loc 3 515\n"
    "\tjmp " LOCAL_LABEL_STRING(_offlineasm_llintOpWithReturn__llintOp__commonOp__fn__fn__makeReturn__fn__fn__loadConstantOrVariable__size__k__57_load__done) "\n" // /home/amar/workspace/WebKit/Source/JavaScriptCore/llint/LowLevelInterpreter64.asm:515

  OFFLINE_ASM_LOCAL_LABEL(_offlineasm_llintOpWithReturn__llintOp__commonOp__fn__fn__makeReturn__fn__fn__loadConstantOrVariable__size__k__57_load__constant)
".loc 3 489\n"
    "\tmovq 16(%rbp), %rdx\n"                                // /home/amar/workspace/WebKit/Source/JavaScriptCore/llint/LowLevelInterpreter64.asm:489
".loc 3 490\n"
    "\tmovq 176(%rdx), %rdx\n"                               // /home/amar/workspace/WebKit/Source/JavaScriptCore/llint/LowLevelInterpreter64.asm:490
".loc 3 491\n"
    "\tmovq -128(%rdx, %rsi, 8), %rdx\n"                     // /home/amar/workspace/WebKit/Source/JavaScriptCore/llint/LowLevelInterpreter64.asm:491

  OFFLINE_ASM_LOCAL_LABEL(_offlineasm_llintOpWithReturn__llintOp__commonOp__fn__fn__makeReturn__fn__fn__loadConstantOrVariable__size__k__57_load__done)

//... truncated for brevity
One can also verify this by dumping the assembly from the debugger:
Dump of assembler code for function llint_op_mov:
   0x00007ffff4e65b4f <+0>: add    r8,r13
   0x00007ffff4e65b52 <+3>: mov    rdi,rbp
   0x00007ffff4e65b55 <+6>: mov    rsi,r8
   0x00007ffff4e65b58 <+9>: mov    r8,rsp
   0x00007ffff4e65b5b <+12>:    and    r8,0xf
   0x00007ffff4e65b5f <+16>:    test   r8,r8
   0x00007ffff4e65b62 <+19>:    je     0x7ffff4e65b6f <llint_op_mov+32>
   0x00007ffff4e65b64 <+21>:    movabs r8,0xbad0c002
   0x00007ffff4e65b6e <+31>:    int3
   0x00007ffff4e65b6f <+32>:    call   0x7ffff5e89bd1 <JavaScript::LLInt::llint_trace(JavaScript::CallFrame*, JavaScript::Instruction const*)>
   0x00007ffff4e65b74 <+37>:    mov    r8,rax
   0x00007ffff4e65b77 <+40>:    sub    r8,r13
   0x00007ffff4e65b7a <+43>:    movsx  rsi,BYTE PTR [r13+r8*1+0x2]
   0x00007ffff4e65b80 <+49>:    cmp    rsi,0x10
   0x00007ffff4e65b84 <+53>:    jge    0x7ffff4e65b8d <llint_op_mov+62>
   0x00007ffff4e65b86 <+55>:    mov    rdx,QWORD PTR [rbp+rsi*8+0x0]
   0x00007ffff4e65b8b <+60>:    jmp    0x7ffff4e65b9d <llint_op_mov+78>
   0x00007ffff4e65b8d <+62>:    mov    rdx,QWORD PTR [rbp+0x10]
   0x00007ffff4e65b91 <+66>:    mov    rdx,QWORD PTR [rdx+0xb0]
   0x00007ffff4e65b98 <+73>:    mov    rdx,QWORD PTR [rdx+rsi*8-0x80]
   0x00007ffff4e65b9d <+78>:    movsx  rsi,BYTE PTR [r13+r8*1+0x1]
   0x00007ffff4e65ba3 <+84>:    mov    QWORD PTR [rbp+rsi*8+0x0],rdx
   0x00007ffff4e65ba8 <+89>:    add    r8,0x3
   0x00007ffff4e65bac <+93>:    movzx  eax,BYTE PTR [r13+r8*1+0x0]
   0x00007ffff4e65bb2 <+99>:    mov    rsi,QWORD PTR [rip+0x2e2264f]        # 0x7ffff7c88208
   0x00007ffff4e65bb9 <+106>:   jmp    QWORD PTR [rsi+rax*8]
   0x00007ffff4e65bbc <+109>:   int3
   0x00007ffff4e65bbd <+110>:   int3
   0x00007ffff4e65bbe <+111>:   add    al,0x2
   0x00007ffff4e65bc0 <+113>:   add    BYTE PTR [rax],al
End of assembler dump.
Fast Path/Slow Path
An important aspect of the LLInt is the concept and implementation of fast and slow paths. The LLInt, by design, is meant to generate fast code with a low latency as possible. The code generated, as seen earlier in this blog post, is typically machine code (e.g. x86 assembly) that implements bytecode operations. However, when executing bytecode the LLInt needs to determine the types of operands it receives with an opcode in order to pick the right execution path. For example consider the the following js code:
let x = 10;
let y = 20;
let z = x+y;
The LLInt when when it executes the add opcode, it will check if the operands passed to it (i.e. x and y) are integers and if so it can implement the addition operation directly in machine code. Now consider the following js code:
let x = 10;
let y = {a : "Ten"};
let z = x+y;
The LLInt can no longer perform addition directly in machine code since the types of x and y are different. In this instance, the LLInt will take slow path of execution which is a call to C++ code to handle cases were there is an operand type mismatch. This is a simplified explanation on how fast and slow paths work and the add opcode in particular has several other checks on its operands in addition to integer checks.
Additionally, when the LLInt needs to call into C++ code, it makes a call to a slow path which is essentially a trampoline into C++. If you’ve been debugging along, you may have noticed calls to callSlowPath or cCall2 as one steps through the execution in the LLInt most of which has been calls to the tracing function which is implemented in C++.
Lets now attempt to debug execution in a slow path. For this exercise the following js program is used:
let x = 10;
let y = "Ten";
x === y;
Which generates the following bytecode dump:
bb#1
[   0] enter
[   1] get_scope          loc4
[   3] mov                loc5, loc4
[   6] check_traps
[   7] mov                loc6, Undefined(const0)
[  10] resolve_scope      loc7, loc4, 0, GlobalProperty, 0
[  17] put_to_scope       loc7, 0, Int32: 10(const1), 1048576<DoNotThrowIfNotFound|GlobalProperty|Initialization|NotStrictMode>, 0, 0
[  25] resolve_scope      loc7, loc4, 1, GlobalProperty, 0
[  32] put_to_scope       loc7, 1, String (atomic),8Bit:(1),length:(3): Ten, StructureID: 22247(const2), 1048576<DoNotThrowIfNotFound|GlobalProperty|Initialization|NotStrictMode>, 0, 0
[  40] mov                loc6, Undefined(const0)
[  43] resolve_scope      loc7, loc4, 0, GlobalProperty, 0
[  50] get_from_scope     loc8, loc7, 0, 2048<ThrowIfNotFound|GlobalProperty|NotInitialization|NotStrictMode>, 0, 0
[  58] mov                loc7, loc8
[  61] resolve_scope      loc8, loc4, 1, GlobalProperty, 0
[  68] get_from_scope     loc9, loc8, 1, 2048<ThrowIfNotFound|GlobalProperty|NotInitialization|NotStrictMode>, 0, 0
[  76] stricteq           loc6, loc7, loc9
[  80] end                loc6
Successors: [ ]

Identifiers:
  id0 = x
  id1 = y

Constants:
   k0 = Undefined
   k1 = Int32: 10: in source as integer
   k2 = String (atomic),8Bit:(1),length:(3): Ten, StructureID: 55445
The bytecode of interest is the stricteq opcode at bc#76. This opcode is defined in LowLevelInterpreter64.asm as follows:
macro strictEqOp(opcodeName, opcodeStruct, createBoolean)
    llintOpWithReturn(op_%opcodeName%, opcodeStruct, macro (size, get, dispatch, return)
        get(m_rhs, t0)
        get(m_lhs, t2)
        loadConstantOrVariable(size, t0, t1)
        loadConstantOrVariable(size, t2, t0)

        # At a high level we do
        # If (left is Double || right is Double)
        #     goto slowPath;
        # result = (left == right);
        # if (result)
        #     goto done;
        # if (left is Cell || right is Cell)
        #     goto slowPath;
        # done:
        # return result;

        # This fragment implements (left is Double || right is Double), with a single branch instead of the 4 that would be naively required if we used branchIfInt32/branchIfNumber
        # The trick is that if a JSValue is an Int32, then adding 1<<49 to it will make it overflow, leaving all high bits at 0
        # If it is not a number at all, then 1<<49 will be its only high bit set
        # Leaving only doubles above or equal 1<<50.
        move t0, t2
        move t1, t3
        move LowestOfHighBits, t5
        addq t5, t2
        addq t5, t3
        orq t2, t3
        lshiftq 1, t5
        bqaeq t3, t5, .slow

        cqeq t0, t1, t5
        btqnz t5, t5, .done #is there a better way of checking t5 != 0 ?

        move t0, t2
        # This andq could be an 'or' if not for BigInt32 (since it makes it possible for a Cell to be strictEqual to a non-Cell)
        andq t1, t2
        btqz t2, notCellMask, .slow

    .done:
        createBoolean(t5)
        return(t5)

    .slow:
        callSlowPath(_slow_path_%opcodeName%)
        dispatch()
    end)
end
One can set a breakpoint at this macro definition and step through the execution of this opcode. There are two reasons to pick this particular opcode, one being that it’s execution paths are simple to follow and don’t introduce unnecessary complexity and the second being that it comes with helpful developer comments to help the reader follow along.
Stepping through the execution, observe that the checks for numbers (i.e. integers and doubles) fails and execution control end up in the section that checks for JSCell headers. The rhs of the stricteq operation passes the isCell check and as a result execution jumps to the label .slow which calls the slow path:
//... truncated for brevity

        move t0, t2
        # This andq could be an 'or' if not for BigInt32 (since it makes it possible for a Cell to be strictEqual to a non-Cell)
        andq t1, t2
        btqz t2, notCellMask, .slow

 //... truncated for brevity

    .slow:
        callSlowPath(_slow_path_%opcodeName%)

//... truncated for brevity
Stepping into the call to callSlowPath leads to the C++ implementation of _slow_path_stricteq defined in CommonSlowPaths.cpp:
JSC_DEFINE_COMMON_SLOW_PATH(slow_path_stricteq)
{
    BEGIN();
    auto bytecode = pc->as<OpStricteq>();
    RETURN(jsBoolean(JSValue::strictEqual(globalObject, GET_C(bytecode.m_lhs).jsValue(), GET_C(bytecode.m_rhs).jsValue())));
}
This stub function retrieves the operand values and passes it to the function JSValue::strictEqual which is defined as follows:
inline bool JSValue::strictEqual(JSGlobalObject* globalObject, JSValue v1, JSValue v2)
{
    if (v1.isInt32() && v2.isInt32())
        return v1 == v2;

    if (v1.isNumber() && v2.isNumber())
        return v1.asNumber() == v2.asNumber();

#if USE(BIGINT32)
    if (v1.isHeapBigInt() && v2.isBigInt32())
        return v1.asHeapBigInt()->equalsToInt32(v2.bigInt32AsInt32());
    if (v1.isBigInt32() && v2.isHeapBigInt())
        return v2.asHeapBigInt()->equalsToInt32(v1.bigInt32AsInt32());
#endif

    if (v1.isCell() && v2.isCell())
        return strictEqualForCells(globalObject, v1.asCell(), v2.asCell());

    return v1 == v2;
}
This function is responsible for performing all the various slower checks to determine if the lhs is strictly equal to the rhs. This concludes our discussion on the fast path/slow path pattern that’s common across all JIT tiers in JavaScriptCore.
Tiering Up
When bytecode has been executed a certain number of times in the LLInt, the bytecodes gets profiled as being warm code and after an execution threshold is reached, the warm code is now considered hot and the LLInt can now tier up to a higher JIT tier. In this case JavaScriptCore would tier up into the Baseline JIT. The graph reproduced4 below shows a timeline on how the tiering up process functions:
The Control section of the WebKit blog3 describes the three main heuristics that are used by the various JIT tiers to determine thresholds for tiering up. These heuristics are execution counts for function calls and loop execution, count exits to count the number of times a function compiled by the optimising JIT tiers exits to a lower tier and recompilation counts which keeps track of the number of times a function is jettisoned to a lower tier.
The LLInt mainly uses execution counts to determine if a function or loop is hot and if the execution of this code should be tiered up. The execution counter in the LLInt utilises the following rules3 to calculate the threshold to tier up:
- Each call to the function adds 15 points to the execution counter.
- Each loop execution adds 1 point to the execution counter.
There are two threshold values used by the LLInt for execution counting. The static value of 500 points is used when no other information about the bytecodes execution or JIT status is captured. As the bytecode executes in the LLInt, tiers up and down, the engine generates a dynamic profile for the threshold value. The excerpt below3 describes how dynamic threshold counts are determined in the LLInt:
Over the years we’ve found ways to dynamically adjust these thresholds based on other sources of information, like:
- Whether the function got JITed the last time we encountered it (according to our cache). Let’s call this
wasJITed.- How big the function is. Let’s call this
S. We use the number of bytecode opcodes plus operands as the size.- How many times it has been recompiled. Let’s call this
R.- How much executable memory is available. Let’s use
Mto say how much executable memory we have total, andUis the amount we estimate that we would use (total) if we compiled this function.- Whether profiling is “full” enough.
We select the LLInt→Baseline threshold based on
wasJITed. If we don’t know (the function wasn’t in the cache) then we use the basic threshold, 500. Otherwise, if the functionwasJITedthen we use 250 (to accelerate tier-up) otherwise we use 2000.
The values of S, R, M and U aren’t used by the LLInt to calculate a dynamic thresholds for tiering up but this will become relevant when exploring the optimising tiers later on in this blog series. The static execution counter thresholds are defined in OptionsList.h. The snippet below shows the values for LLInt→Baseline thresholds:
v(Int32, thresholdForJITAfterWarmUp, 500, Normal, nullptr) \
v(Int32, thresholdForJITSoon, 100, Normal, nullptr) \
\
//... code truncated for brevity
v(Int32, executionCounterIncrementForLoop, 1, Normal, nullptr) \
v(Int32, executionCounterIncrementForEntry, 15, Normal, nullptr) \
The execution counters that track these values are defined in ExecutionCounter.h. The snippet below shows the three key counters that are referenced and updated by the LLInt.
    // This counter is incremented by the JIT or LLInt. It starts out negative and is
    // counted up until it becomes non-negative. At the start of a counting period,
    // the threshold we wish to reach is m_totalCount + m_counter, in the sense that
    // we will add X to m_totalCount and subtract X from m_counter.
    int32_t m_counter;

    // Counts the total number of executions we have seen plus the ones we've set a
    // threshold for in m_counter. Because m_counter's threshold is negative, the
    // total number of actual executions can always be computed as m_totalCount +
    // m_counter.
    float m_totalCount;

    // This is the threshold we were originally targeting, without any correction for
    // the memory usage heuristics.
    int32_t m_activeThreshold;
Each CodeBlock parsed by the engine instantiates two ExecutionCounter objects. These are the m_llintExecuteCounter and the m_jitExecuteCounter. The m_llintExecuteCounter is most relevant for this blog post as it determines the threshold to tier up into the Baseline JIT.
    BaselineExecutionCounter m_llintExecuteCounter;

    BaselineExecutionCounter m_jitExecuteCounter;
With the understanding of how thresholds work, lets trace this in the code base to better understand this behaviour. To being, enable the Baseline JIT in launch.json to allow the LLInt to tier up and at the same time ensure that the optimising tiers are disabled. This is done by removing the --useJIT=false flag and adding the --useDFGJIT=false flag to the commandline arguments. The launch.json should look as follows:
{
    "version": "0.2.0",
    "configurations": [
        {
            "name": "(gdb) Launch",
            "type": "cppdbg",
            "request": "launch",
            "program": "/home/amar/workspace/WebKit/WebKitBuild/Debug/bin/jsc",
            "args": ["--reportCompileTimes=true", "--dumpGeneratedBytecodes=true", "--useDFGJIT=false", "/home/amar/workspace/WebKit/WebKitBuild/Debug/bin/test.js"],
            //... truncated for brevity
        }
    ]
}
In addition, also add the --reportCompileTimes=true flag to log a notification to stdout when CodeBlock is compiled by the Baseline JIT and other tiers. Now that the debugging environment has been updated, lets create the following test script to trigger baseline compilation:
$ cat test.js

function jitMe(x,y){
    return x+y;
}

let x = 1;

for(let y = 0; y < 300; y++){
    jitMe(x,y)
}
In the javascript program above, our goal is to attempt to execute the function jitMe over several iterations of the for-loop in order for it to be optimised by the Baseline JIT. The LLInt determines when a function/codeblock should be optimised with the call the macro checkSwitchToJIT:
macro checkSwitchToJIT(increment, action)
    loadp CodeBlock[cfr], t0
    baddis increment, CodeBlock::m_llintExecuteCounter + BaselineExecutionCounter::m_counter[t0], .continue
    action()
    .continue:
end
Setting a breakpoint at this macro allows examining the counter values in the debugger. Pausing execution at this breakpoint and listing of instructions is shown below:
Thread 1 "jsc" hit Breakpoint 3, llint_op_ret () at /home/amar/workspace/WebKit/Source/JavaScriptCore/llint/LowLevelInterpreter.asm:1273
1273        baddis increment, CodeBlock::m_llintExecuteCounter + BaselineExecutionCounter::m_counter[t0], .continue
-exec x/4i $rip
=> 0x7ffff4e71e1c <llint_op_ret+47>:    add    DWORD PTR [rax+0xe8],0xa
   0x7ffff4e71e23 <llint_op_ret+54>:    js     0x7ffff4e71e50 <llint_op_ret+99>
   0x7ffff4e71e25 <llint_op_ret+56>:    add    r8,r13
   0x7ffff4e71e28 <llint_op_ret+59>:    mov    rdi,rbp
The memory address pointed to by rax+0xe8 is the value of m_counter which has a value of -500 and is incremented by a value of 15 (0xa). When this value reaches zero, it triggers Baseline optimisation with the call to action. Allowing the program to continue execution in our debugger and run to completion, generates the following output:
<global>#CLzrku:[0x7fffae3c4000->0x7fffeedcb768, NoneGlobal, 116]: 28 instructions (0 16-bit instructions, 0 32-bit instructions, 10 instructions with metadata); 236 bytes (120 metadata bytes); 1 parameter(s); 18 callee register(s); 6 variable(s); scope at loc4

bb#1
[   0] enter
[   1] get_scope          loc4
#... truncated for brevity

jitMe#AQcl4Q:[0x7fffae3c4130->0x7fffae3e5100, NoneFunctionCall, 15]: 6 instructions (0 16-bit instructions, 0 32-bit instructions, 1 instructions with metadata); 135 bytes (120 metadata bytes); 3 parameter(s); 8 callee register(s); 6 variable(s); scope at loc4

bb#1
[   0] enter
[   1] get_scope          loc4
[   3] mov                loc5, loc4
[   6] check_traps
[   7] add                loc6, arg1, arg2, OperandTypes(126, 126)
[  13] ret                loc6
Successors: [ ]


Optimized jitMe#AQcl4Q:[0x7fffae3c4130->0x7fffae3e5100, LLIntFunctionCall, 15] with Baseline JIT into 960 bytes in 1.078797 ms.
As can be seen from the last line of the output above, the function jitMe has been optimised by the Baseline JIT. The next section will explore both compilation and execution in the Baseline JIT.
Baseline JIT
In a nutshell, the Baseline JIT is a template JIT and what that means is that it generates specific machine code for the bytecode operation. There are two key factors that allow the Baseline JIT a speed up over the LLInt3:
- Removal of interpreter dispatch. Interpreter dispatch is the costliest part of interpretation, since the indirect branches used for selecting the implementation of an opcode are hard for the CPU to predict. This is the primary reason why Baseline is faster than LLInt.
- Comprehensive support for polymorphic inline caching. It is possible to do sophisticated inline caching in an interpreter, but currently our best inline caching implementation is the one shared by the JITs.
The following sections will trace how the execution thresholds are reached, how execution transitions from LLInt to the Baseline JIT code via OSR (On Stack Replacement) and the assembly emitted by the Baseline JIT.
Implementation
Majority of the code for the Baseline JIT can be found under JavaScriptCore/jit. The JIT ABI is defined in JIT.h which will be a key item to review as part of the Baseline JIT and defines the various optimised templates for opcodes.
The Baseline JIT templates call assemblers defined in JavaScriptCore/assembler to emit machine code for the target architecture. For example the assemblers used to emit machine code for x86 architectures can be found under MacroAssemblerX86_64.h and X86Assembler.h
Tracing Execution
To enhance tracing in the Baseline JIT one can enable the --verboseOSR=true commandline flag in our launch.json. This flag will enable printing of useful information on the stages of optimisation from the LLInt to the Baseline JIT. The key statistic being the threshold counts for tiering up. Here’s an example of what the output with verboseOSR enabled would look like when executing out test script from the previous section:
#... truncated for brevity

Installing <global>#CLzrku:[0x7fffae3c4000->0x7fffeedcb768, LLIntGlobal, 116]
jitMe#AQcl4Q:[0x7fffae3c4130->0x7fffae3e5100, NoneFunctionCall, 15]: Optimizing after warm-up.
jitMe#AQcl4Q:[0x7fffae3c4130->0x7fffae3e5100, NoneFunctionCall, 15]: bytecode cost is 15.000000, scaling execution counter by 1.072115 * 1
jitMe#AQcl4Q:[0x7fffae3c4130->0x7fffae3e5100, NoneFunctionCall, 15]: 6 instructions (0 16-bit instructions, 0 32-bit instructions, 1 instructions with metadata); 135 bytes (120 metadata bytes); 3 parameter(s); 8 callee register(s); 6 variable(s); scope at loc4

bb#1
[   0] enter
[   1] get_scope          loc4
[   3] mov                loc5, loc4
[   6] check_traps
[   7] add                loc6, arg1, arg2, OperandTypes(126, 126)
[  13] ret                loc6
Successors: [ ]


Installing jitMe#AQcl4Q:[0x7fffae3c4130->0x7fffae3e5100, LLIntFunctionCall, 15]
jitMe#AQcl4Q:[0x7fffae3c4130->0x7fffae3e5100, LLIntFunctionCall, 15]: Entered entry_osr_function_for_call with executeCounter = 500.001038/500.000000, 0
jitMe#AQcl4Q:[0x7fffae3c4130->0x7fffae3e5100, LLIntFunctionCall, 15]: Entered replace with executeCounter = 100.000214/100.000000, 0
jitMe#AQcl4Q:[0x7fffae3c4130->0x7fffae3e5100, LLIntFunctionCall, 15]: Entered replace with executeCounter = 105.000214/100.000000, 5
jitMe#AQcl4Q:[0x7fffae3c4130->0x7fffae3e5100, LLIntFunctionCall, 15]: Entered replace with executeCounter = 105.000214/100.000000, 5

#... truncated for brevity

Optimized jitMe#AQcl4Q:[0x7f85f7ac4130->0x7f85f7ae5100, LLIntFunctionCall, 15] with Baseline JIT into 960 bytes in 0.810440 ms.
jitMe#AQcl4Q:[0x7f85f7ac4130->0x7f85f7ae5100, LLIntFunctionCall, 15]: Entered replace with executeCounter = 105.000351/100.000000, 5
    JIT compilation successful.
Installing jitMe#AQcl4Q:[0x7f85f7ac4130->0x7f85f7ae5100, BaselineFunctionCall, 15]
    Code was already compiled.
Compiling the CodeBlock is a concurrent process and JavaScriptCore spawns a JITWorker thread to being compiling the codeblock with the Baseline JIT. In the interest of simplifying our debugging process, disable concurrent compilation and force compilation to occur on the main jsc thread. In order to do this add the --useConcurrentJIT=false flag to launch.json or on the commandline.
Additionally, JavaScriptCore provides two useful flags that allows adjustment to the JIT compilation threshold counters. These flags are --thresholdForJITSoon and --thresholdForJITAfterWarmUp. By adding the flag --thresholdForJITAfterWarmUp=10 reduce the static threshold count to initiate Baseline JIT optimisation from the default JITAfterWarmUp value of 500 to 10. If the engine determines that the codeblock was JIT compiled previously, it will use the JIT threshold default JITSoon of 100 which will be reduced to the value of 10 by using --thresholdForJITSoon=10.
Our launch.json should now look as follows:
{
    "version": "0.2.0",
    "configurations": [
        {
            "name": "(gdb) Launch",
            "type": "cppdbg",
            "request": "launch",
            "program": "/home/amar/workspace/WebKit/WebKitBuild/Debug/bin/jsc",
            "args": ["--reportCompileTimes=true", "--dumpGeneratedBytecodes=true", "--useDFGJIT=false", "--verboseOSR=true", "--useConcurrentJIT=false", "--thresholdForJITAfterWarmUp=10", "--thresholdForJITSoon=10", "/home/amar/workspace/WebKit/WebKitBuild/Debug/bin/test.js"],
            //... truncated for brevity
        }
    ]
}
With these additional flags, lets now attempt to trace the optimisation of the following test program:
$ cat test.js

for(let x = 0; x < 5; x++){
    let y = x+10;
}
The bytecodes generated for this program are listed below:
<global>#DETOqr:[0x7fffae3c4000->0x7fffeedcb768, NoneGlobal, 43]: 16 instructions (0 16-bit instructions, 0 32-bit instructions, 2 instructions with metadata); 163 bytes (120 metadata bytes); 1 parameter(s); 10 callee register(s); 6 variable(s); scope at loc4

bb#1
[   0] enter
[   1] get_scope          loc4
[   3] mov                loc5, loc4
[   6] check_traps
[   7] mov                loc6, Undefined(const0)
[  10] mov                loc6, Undefined(const0)
[  13] mov                loc7, <JSValue()>(const1)
[  16] mov                loc7, Int32: 0(const2)
[  19] jnless             loc7, Int32: 5(const3), 22(->41)
Successors: [ #3 #2 ]

bb#2
[  23] loop_hint
[  24] check_traps
[  25] mov                loc8, <JSValue()>(const1)
[  28] add                loc8, loc7, Int32: 10(const4), OperandTypes(126, 3)
[  34] inc                loc7
[  37] jless              loc7, Int32: 5(const3), -14(->23)
Successors: [ #2 #3 ]

bb#3
[  41] end                loc6
Successors: [ ]


Constants:
   k0 = Undefined
   k1 = <JSValue()>
   k2 = Int32: 0: in source as integer
   k3 = Int32: 5: in source as integer
   k4 = Int32: 10: in source as integer
The opcode loop_hint in basic block bb#2 is responsible for incrementing the JIT threshold counters, initiating compilation by the Baseline JIT if the execution threshold is breached and performing OSR entry. The loop_hint opcode is defined in LowLevelInterpreter.asm which essentially calls the macro checkSwitchToJITForLoop to determine if an OSR is required.
macro checkSwitchToJITForLoop()
    checkSwitchToJIT(
        1,
        macro()
            storePC()
            prepareStateForCCall()
            move cfr, a0
            move PC, a1
            cCall2(_llint_loop_osr)
            btpz r0, .recover
            move r1, sp
            jmp r0, JSEntryPtrTag
        .recover:
            loadPC()
        end)
end
The macro checkSwitchToJIT as seen in the previous section determines if the JIT threshold has been breached and performs a slow path call to _llint_loop_osr. This slow path, loop_osr is defined LLIntSlowPaths.cpp and is listed below:
LLINT_SLOW_PATH_DECL(loop_osr)
{
    //... code truncated for brevity

    auto loopOSREntryBytecodeIndex = BytecodeIndex(codeBlock->bytecodeOffset(pc));

    //... code truncated for brevity

    if (!jitCompileAndSetHeuristics(vm, codeBlock, loopOSREntryBytecodeIndex))  <-- Compilation with Baseline JIT
        LLINT_RETURN_TWO(nullptr, nullptr);

    //... code truncated for brevity

    const JITCodeMap& codeMap = codeBlock->jitCodeMap();
    CodeLocationLabel<JSEntryPtrTag> codeLocation = codeMap.find(loopOSREntryBytecodeIndex); <-- Retrieve location of the compiled code
    ASSERT(codeLocation);

    void* jumpTarget = codeLocation.executableAddress();
    ASSERT(jumpTarget);

    LLINT_RETURN_TWO(jumpTarget, callFrame->topOfFrame()); <-- Perform OSR to the location of the compiled code
}
As the truncated snippet above indicates, the function will first compile codeBlock with the call to jitCompileAndSetHeuristics and if the compilation succeeds, it will jump to the target address of the compiled code and resume execution. In addition to loop_osr there are additional flavours of OSR supported by the LLInt. These are entry_osr, entry_osr_function_for_call, entry_osr_function_for_construct, entry_osr_function_for_call_arityCheck and entry_osr_function_for_construct_arityCheck an essentially perform the same function as loop_osr and are defined here in LLIntSlowPaths.cpp.
Compilation
Let’s now examine how codeblock compilation works by stepping through the function jitCompileAndSetHeuristics:
inline bool jitCompileAndSetHeuristics(VM& vm, CodeBlock* codeBlock, BytecodeIndex loopOSREntryBytecodeIndex = BytecodeIndex(0))
{
    //... code truncated for brevity

    JITWorklist::ensureGlobalWorklist().poll(vm);

    switch (codeBlock->jitType()) {
    case JITType::BaselineJIT: {
        dataLogLnIf(Options::verboseOSR(), "    Code was already compiled.");
        codeBlock->jitSoon();
        return true;
    }
    case JITType::InterpreterThunk: {
        JITWorklist::ensureGlobalWorklist().compileLater(codeBlock, loopOSREntryBytecodeIndex);
        return codeBlock->jitType() == JITType::BaselineJIT;
    }
    default:
        dataLog("Unexpected code block in LLInt: ", *codeBlock, "\n");
        RELEASE_ASSERT_NOT_REACHED();
        return false;
    }
}
The function performs a simple check to determine if the codeBlock supplied needs to be JIT compiled and if compilation is required initiates a compilation thread with the call to JITWorkList::compileLater:
JITWorklist::ensureGlobalWorklist().compileLater(codeBlock, loopOSREntryBytecodeIndex);
return codeBlock->jitType() == JITType::BaselineJIT;
Since concurrent JIT is disabled (from adding the --useConcurrentJIT=false flag), the function JITWorkList::compileLater calls Plan::compileNow to initiate compilation on the main jsc thread:
static void compileNow(CodeBlock* codeBlock, BytecodeIndex loopOSREntryBytecodeIndex)
    {
        Plan plan(codeBlock, loopOSREntryBytecodeIndex);
        plan.compileInThread();
        plan.finalize();
    }
The function Plan::compileInThread ends up calling JIT::compileWithoutLinking which essentially compiles the codeblock by utilising the MacroAssemblers to emit specific machine code for each bytecode in the instruction stream. The function compileWithoutLinking is listed below with the unimportant code truncated out:
void JIT::compileWithoutLinking(JITCompilationEffort effort)
{
    //... code truncated for brevity

    m_pcToCodeOriginMapBuilder.appendItem(label(), CodeOrigin(BytecodeIndex(0)));

    //... code truncated for brevity

    emitFunctionPrologue();
    emitPutToCallFrameHeader(m_codeBlock, CallFrameSlot::codeBlock);

    //... code truncated for brevity

    move(regT1, stackPointerRegister);
    checkStackPointerAlignment();

    emitSaveCalleeSaves();
    emitMaterializeTagCheckRegisters();

    //... code truncated for brevity

    privateCompileMainPass();
    privateCompileLinkPass();
    privateCompileSlowCases();

    //... code truncated for brevity

    m_bytecodeIndex = BytecodeIndex(0);

    //... code truncated for brevity

    privateCompileExceptionHandlers();

    //... code truncated for brevity

    m_pcToCodeOriginMapBuilder.appendItem(label(), PCToCodeOriginMapBuilder::defaultCodeOrigin());

    m_linkBuffer = std::unique_ptr<LinkBuffer>(new LinkBuffer(*this, m_codeBlock, effort));

    //... code truncated for brevity
}
The first few function calls emitFunctionPrologue() up until emitMaterializeTagCheckRegisters() emit machine code to perform stack management routines to be included in the Baseline JIT compiled code.
A handy setting to enable with the codebase to allow tracing of the various compilation passes would be the JITInternal::verbose flag.
namespace JITInternal {
static constexpr const bool verbose = true;
}
By enabling this flag, each bytecode being compiled would now be logged to stdout. This should look something similar to the snippet below:
Compiling <global>#DETOqr:[0x7fffae3c4000->0x7fffeedcb768, NoneGlobal, 43]
Baseline JIT emitting code for bc#0 at offset 168
At 0: 0
Baseline JIT emitting code for bc#1 at offset 294
At 1: 0
Baseline JIT emitting code for bc#3 at offset 306
At 3: 0
Baseline JIT emitting code for bc#6 at offset 314
//... truncated for brevity
The first interesting function call is privateCompileMainPass().
void JIT::privateCompileMainPass()
{
    //... truncated for brevity

    auto& instructions = m_codeBlock->instructions();
    unsigned instructionCount = m_codeBlock->instructions().size();

    m_callLinkInfoIndex = 0;

    VM& vm = m_codeBlock->vm();
    BytecodeIndex startBytecodeIndex(0);

    //... code truncated for brevity

    m_bytecodeCountHavingSlowCase = 0;
    for (m_bytecodeIndex = BytecodeIndex(0); m_bytecodeIndex.offset() < instructionCount; ) {
        unsigned previousSlowCasesSize = m_slowCases.size();
        if (m_bytecodeIndex == startBytecodeIndex && startBytecodeIndex.offset() > 0) {
            // We've proven all bytecode instructions up until here are unreachable.
            // Let's ensure that by crashing if it's ever hit.
            breakpoint();
        }

        //... code truncated for brevity
        const Instruction* currentInstruction = instructions.at(m_bytecodeIndex).ptr();

        //... code truncated for brevity

        OpcodeID opcodeID = currentInstruction->opcodeID();

        //... code truncated for brevity

        unsigned bytecodeOffset = m_bytecodeIndex.offset();

        //... code truncated for brevity

        switch (opcodeID) {

        //... code truncated for brevity

        DEFINE_OP(op_del_by_id)
        DEFINE_OP(op_del_by_val)
        DEFINE_OP(op_div)
        DEFINE_OP(op_end)
        DEFINE_OP(op_enter)
        DEFINE_OP(op_get_scope)

        //... code truncated for brevity

        DEFINE_OP(op_lshift)
        DEFINE_OP(op_mod)
        DEFINE_OP(op_mov)
        //... code truncated for brevity
        default:
            RELEASE_ASSERT_NOT_REACHED();
        }

        //... code truncated for brevity
    }
}
The function loops over the bytecodes and calls the relevant JIT opcode for each bytecode. For example the first bytecode to be evaluated is op_enter which, via the switch case DEFINE_OP(op_enter), calls the function JIT::emit_op_enter. Let’s trace the mov opcode at bc#3, which moves the value in loc4 into loc5:
[ 3] mov loc5, loc4
setting a breakpoint at DEFINE_OP(op_mov) and stepping into the function call leads to JIT::emit_op_mov
void JIT::emit_op_mov(const Instruction* currentInstruction)
{
    auto bytecode = currentInstruction->as<OpMov>();
    VirtualRegister dst = bytecode.m_dst;
    VirtualRegister src = bytecode.m_src;

    if (src.isConstant()) {
        JSValue value = m_codeBlock->getConstant(src);
        if (!value.isNumber())
            store64(TrustedImm64(JSValue::encode(value)), addressFor(dst));
        else
            store64(Imm64(JSValue::encode(value)), addressFor(dst));
        return;
    }

    load64(addressFor(src), regT0);
    store64(regT0, addressFor(dst));
}
The functions load64 and store64 are defined in assembler/MacroAssemblerX86_64.h. The functions call an assembler which is responsible for emitting machine code for the operation. Lets examine the following load64 call:
void load64(ImplicitAddress address, RegisterID dest)
{
    m_assembler.movq_mr(address.offset, address.base, dest);
}
The function movq_mr is defined in X86Assembler.h as follows:
void movq_mr(int offset, RegisterID base, RegisterID dst)
    {
        m_formatter.oneByteOp64(OP_MOV_GvEv, dst, base, offset);
    }
The function oneByteOp64 listed above finally generates the machine code that gets written to an instruction buffer:
void oneByteOp64(OneByteOpcodeID opcode, int reg, RegisterID base, int offset)
{
            SingleInstructionBufferWriter writer(m_buffer);
            writer.emitRexW(reg, 0, base);
            writer.putByteUnchecked(opcode);
            writer.memoryModRM(reg, base, offset);
}
In this fashion, each bytecode is processed by the function JIT::privateCompileMainPass to emit Baseline JIT optimised machine code. The second function that needs to be considered is JIT::privateCompileLinkPass, which is responsible for adjusting the jump table to ensure the optimised bytecodes can reach the right execution branches (e.g. labels):
void JIT::privateCompileLinkPass()
{
    unsigned jmpTableCount = m_jmpTable.size();
    for (unsigned i = 0; i < jmpTableCount; ++i)
        m_jmpTable[i].from.linkTo(m_labels[m_jmpTable[i].toBytecodeOffset], this);
    m_jmpTable.clear();
}
Once the jump table has been re-linked appropriately, the next function of note to be called is JIT::privateCompileSlowCases.
Fast Path/Slow Path
As seen in previous sections when reviewing the LLInt, some opcodes define two types of execution paths: fast path and slow paths. The Baseline JIT when compiling bytecodes performs additional optimisations on opcodes that implement fast and slow paths. This compilation phase is performed by the call to JIT::privateCompileSlowCases:
void JIT::privateCompileSlowCases()
{
    m_getByIdIndex = 0;
    m_getByValIndex = 0;
    m_getByIdWithThisIndex = 0;
    m_putByIdIndex = 0;
    m_inByIdIndex = 0;
    m_delByValIndex = 0;
    m_delByIdIndex = 0;
    m_instanceOfIndex = 0;
    m_byValInstructionIndex = 0;
    m_callLinkInfoIndex = 0;

    //... code truncated for brevity
    unsigned bytecodeCountHavingSlowCase = 0;
    for (Vector<SlowCaseEntry>::iterator iter = m_slowCases.begin(); iter != m_slowCases.end();) {
        m_bytecodeIndex = iter->to;

        //... code truncated for brevity

        BytecodeIndex firstTo = m_bytecodeIndex;

        const Instruction* currentInstruction = m_codeBlock->instructions().at(m_bytecodeIndex).ptr();

        //... code truncated for brevity

        switch (currentInstruction->opcodeID()) {
        DEFINE_SLOWCASE_OP(op_add)
        DEFINE_SLOWCASE_OP(op_call)
        //... code truncated for brevity
        DEFINE_SLOWCASE_OP(op_jstricteq)
        case op_put_by_val_direct:
        DEFINE_SLOWCASE_OP(op_put_by_val)
        DEFINE_SLOWCASE_OP(op_del_by_val)
        DEFINE_SLOWCASE_OP(op_del_by_id)
        DEFINE_SLOWCASE_OP(op_sub)
        DEFINE_SLOWCASE_OP(op_has_indexed_property)
        DEFINE_SLOWCASE_OP(op_get_from_scope)
        DEFINE_SLOWCASE_OP(op_put_to_scope)

        //... code truncated for brevity
        default:
            RELEASE_ASSERT_NOT_REACHED();
        }

        //... code truncated for brevity

        emitJumpSlowToHot(jump(), 0);
        ++bytecodeCountHavingSlowCase;
    }

    //... code truncated for brevity
}
The function iterates over bytecodes that implement a slow path and emit machine code for each of these opcodes and also updates the jump table as required. Tracing the execution of emitted machine code for opcodes that implement a slow path is left to the reader as an exercise.
Linking
Once the codeblock has been successfully compiled, the next step is to link the machine code emitted by the assembler in order for the LLInt to OSR into the Baseline JIT optimised code. This beings by generating a LinkBuffer for the codeblock:
m_linkBuffer = std::unique_ptr<LinkBuffer>(new LinkBuffer(*this, m_codeBlock, effort));
The developer comments have the following to note about LinkBuffer:
LinkBuffer:
This class assists in linking code generated by the macro assembler, once code generation has been completed, and the code has been copied to is final location in memory. At this time pointers to labels within the code may be resolved, and relative offsets to external addresses may be fixed.
Specifically:
- Jump objects may be linked to external targets,
- The address of Jump objects may taken, such that it can later be relinked.
- The return address of a Call may be acquired.
- The address of a Label pointing into the code may be resolved.
- The value referenced by a DataLabel may be set.
Initialisation of the LinkBuffer, eventually leads to a call to LinkBuffer::linkCode which is listed below:
void LinkBuffer::linkCode(MacroAssembler& macroAssembler, JITCompilationEffort effort)
{
    //... code truncated for brevity
    allocate(macroAssembler, effort);
    if (!m_didAllocate)
        return;
    ASSERT(m_code);
    AssemblerBuffer& buffer = macroAssembler.m_assembler.buffer();
    void* code = m_code.dataLocation();
    //... code truncated for brevity

    performJITMemcpy(code, buffer.data(), buffer.codeSize());

    //.. code truncated for brevity
    m_linkTasks = WTFMove(macroAssembler.m_linkTasks);
}
The key function in the snippet above is performJITMemcpy, which is a wrapper to memcpy. The emitted unlinked machine code which is stored in the assembler buffer is is copied over to the LinkeBuffer which is pointed to via code:
performJITMemcpy(code, buffer.data(), buffer.codeSize());
Once the LinkBuffer has been populated, the machine code is linked with the call to JIT::link which is invoked from JITWorklist::Plan::finalize:
CompilationResult JIT::link()
{
    LinkBuffer& patchBuffer = *m_linkBuffer;

    if (patchBuffer.didFailToAllocate())
        return CompilationFailed;

    // Translate vPC offsets into addresses in JIT generated code, for switch tables.
    for (auto& record : m_switches) {
        //... code to handle swtich cases truncated for brevity
    }

    for (size_t i = 0; i < m_codeBlock->numberOfExceptionHandlers(); ++i) {
        //... code to handle exception handlers truncated for brevity
    }

    for (auto& record : m_calls) {
        if (record.callee)
            patchBuffer.link(record.from, record.callee);
    }

    finalizeInlineCaches(m_getByIds, patchBuffer);
    finalizeInlineCaches(m_getByVals, patchBuffer);
    finalizeInlineCaches(m_getByIdsWithThis, patchBuffer);
    finalizeInlineCaches(m_putByIds, patchBuffer);
    finalizeInlineCaches(m_delByIds, patchBuffer);
    finalizeInlineCaches(m_delByVals, patchBuffer);
    finalizeInlineCaches(m_inByIds, patchBuffer);
    finalizeInlineCaches(m_instanceOfs, patchBuffer);

    //... code truncated for brevity

    {
        JITCodeMapBuilder jitCodeMapBuilder;
        for (unsigned bytecodeOffset = 0; bytecodeOffset < m_labels.size(); ++bytecodeOffset) {
            if (m_labels[bytecodeOffset].isSet())
                jitCodeMapBuilder.append(BytecodeIndex(bytecodeOffset), patchBuffer.locationOf<JSEntryPtrTag>(m_labels[bytecodeOffset]));
        }
        m_codeBlock->setJITCodeMap(jitCodeMapBuilder.finalize());
    }

    MacroAssemblerCodePtr<JSEntryPtrTag> withArityCheck = patchBuffer.locationOf<JSEntryPtrTag>(m_arityCheck);

    //... code truncated for brevity

    CodeRef<JSEntryPtrTag> result = FINALIZE_CODE(
        patchBuffer, JSEntryPtrTag,
        "Baseline JIT code for %s", toCString(CodeBlockWithJITType(m_codeBlock, JITType::BaselineJIT)).data());

    //... code truncated for brevity

    m_codeBlock->setJITCode(
        adoptRef(*new DirectJITCode(result, withArityCheck, JITType::BaselineJIT)));

    if (JITInternal::verbose)
        dataLogF("JIT generated code for %p at [%p, %p).\n", m_codeBlock, result.executableMemory()->start().untaggedPtr(), result.executableMemory()->end().untaggedPtr());

    return CompilationSuccessful;
}
Once linking has completed, a reference pointer to the JITed code is set in the codeblock. The Baseline JIT optimised code is now ready to be executed. The call stack at this point should resemble something similar to the snippet below:
libJavaScriptCore.so.1!JSC::JIT::link(JSC::JIT * const this) (/home/amar/workspace/WebKit/Source/JavaScriptCore/jit/JIT.cpp:970)
libJavaScriptCore.so.1!JSC::JITWorklist::Plan::finalize(JSC::JITWorklist::Plan * const this) (/home/amar/workspace/WebKit/Source/JavaScriptCore/jit/JITWorklist.cpp:55)
libJavaScriptCore.so.1!JSC::JITWorklist::Plan::compileNow(JSC::CodeBlock * codeBlock, JSC::BytecodeIndex loopOSREntryBytecodeIndex) (/home/amar/workspace/WebKit/Source/JavaScriptCore/jit/JITWorklist.cpp:87)
libJavaScriptCore.so.1!JSC::JITWorklist::compileLater(JSC::JITWorklist * const this, JSC::CodeBlock * codeBlock, JSC::BytecodeIndex loopOSREntryBytecodeIndex) (/home/amar/workspace/WebKit/Source/JavaScriptCore/jit/JITWorklist.cpp:238)
libJavaScriptCore.so.1!JSC::LLInt::jitCompileAndSetHeuristics(JSC::VM & vm, JSC::CodeBlock * codeBlock, JSC::BytecodeIndex loopOSREntryBytecodeIndex) (/home/amar/workspace/WebKit/Source/JavaScriptCore/llint/LLIntSlowPaths.cpp:386)
libJavaScriptCore.so.1!JSC::LLInt::llint_loop_osr(JSC::CallFrame * callFrame, const JSC::Instruction * pc) (/home/amar/workspace/WebKit/Source/JavaScriptCore/llint/LLIntSlowPaths.cpp:481)
libJavaScriptCore.so.1!llint_op_loop_hint() (/home/amar/workspace/WebKit/Source/JavaScriptCore/llint/LowLevelInterpreter64.asm:97)
[Unknown/Just-In-Time compiled code] (Unknown Source:0)
One can dump the disassembly of the JITed code by adding the --dumpDisassembly=true flag to launch.json or to the commandline. The disassembly for the compiled bytecodes printed to stdout would appear as follows:
Generated Baseline JIT code for <global>#DETOqr:[0x7fffae3c4000->0x7fffeedcb768, BaselineGlobal, 43], instructions size = 43
   Source: for(let x = 0; x < 5; x++){ let y = x+10; }
   Code at [0x7fffaecff680, 0x7fffaecfffc0):
          0x7fffaecff680: nop
          0x7fffaecff681: push %rbp
          0x7fffaecff682: mov %rsp, %rbp
          0x7fffaecff685: mov $0x7fffae3c4000, %r11
          #... truncated for brevity
    [   0] enter
          0x7fffaecff728: push %rax
          0x7fffaecff729: mov $0x7ffff4f69936, %rax
          0x7fffaecff733: push %rcx
          #... truncated for brevity
    [   1] get_scope          loc4
          0x7fffaecff7d4: push %rax
          0x7fffaecff7d5: mov $0x7ffff4f69936, %rax
          0x7fffaecff7df: push %rcx
          #... truncated for brevity
    [  23] loop_hint
          0x7fffaecff9a8: push %rax
          0x7fffaecff9a9: mov $0x7ffff4f69936, %rax
          0x7fffaecff9b3: push %rcx
          0x7fffaecff9b4: mov $0x7ffff4f6a88b, %rcx
          0x7fffaecff9be: push %rdx
          0x7fffaecff9bf: mov $0x7ffff4f63e72, %rdx
          0x7fffaecff9c9: push %rbx
          0x7fffaecff9ca: mov $0x7fffeedfe628, %rbx
          0x7fffaecff9d4: call *%rax
    (End Of Main Path)
    (S) [   6] check_traps
          0x7fffaecffb70: push %rax
          0x7fffaecffb71: mov $0x7ffff4f69936, %rax
          0x7fffaecffb7b: push %rcx
          0x7fffaecffb7c: mov $0x7ffff4f6a88b, %rcx
          #... truncated for brevity
    (S) [  28] add                loc8, loc7, Int32: 10(const4), OperandTypes(126, 3)
          0x7fffaecffd0d: push %rax
          0x7fffaecffd0e: mov $0x7ffff4f69936, %rax
          0x7fffaecffd18: push %rcx
          #... truncated for brevity
    (S) [  34] inc                loc7
          0x7fffaecffd99: push %rax
          0x7fffaecffd9a: mov $0x7ffff4f69936, %rax
          0x7fffaecffda4: push %rcx
          #... truncated for brevity
    (S) [  37] jless              loc7, Int32: 5(const3), -14(->23)
          0x7fffaecffe10: push %rax
          0x7fffaecffe11: mov $0x7ffff4f69936, %rax
          0x7fffaecffe1b: push %rcx
          0x7fffaecffe1c: mov $0x7ffff4f6a88b, %rcx
          0x7fffaecffe26: push %rdx
          #... truncated for brevity
    (End Of Slow Path)
          0x7fffaecffec5: mov $0x7fffae3c4000, %rdi
          0x7fffaecffecf: mov $0x0, 0x24(%rbp)
          0x7fffaecffed6: mov $0x7fffaeb09fd8, %r11
          #... truncated for brevity
JIT generated code for 0x7fffae3c4000 at [0x7fffaecff680, 0x7fffaecfffc0).
JIT Execution
Stepping back up the call stack, execution returns to llint_loop_osr. The compiled and linked machine code is now referenced by codeBlock and to complete the OSR to the JITed code, the engine needs to retrieve the executableAddress to the JITed code and have the LLInt jump to this address and continue execution:
if (!jitCompileAndSetHeuristics(vm, codeBlock, loopOSREntryBytecodeIndex))
        LLINT_RETURN_TWO(nullptr, nullptr);

    //... code truncated for brevity

    const JITCodeMap& codeMap = codeBlock->jitCodeMap();
    CodeLocationLabel<JSEntryPtrTag> codeLocation = codeMap.find(loopOSREntryBytecodeIndex);

    void* jumpTarget = codeLocation.executableAddress();

    LLINT_RETURN_TWO(jumpTarget, callFrame->topOfFrame());
The snippet code demonstrates how the engine first retrieves a codeMap of the compiled codeBlock and then looks up the codeLocation of the bytecode index that OSR entry is to be performed. In our example, this is the loop_hint bytecode index. The executable address is retrieved from codeLocation and along with the callFrame is passed as arguments to LLINT_RETURN_TWO. The call to LLINT_RETURN_TWO returns execution back to the checkSwitchToJITForLoop:
macro checkSwitchToJITForLoop()
    checkSwitchToJIT(
        1,
        macro()
            storePC()
            prepareStateForCCall()
            move cfr, a0
            move PC, a1
            cCall2(_llint_loop_osr)
            btpz r0, .recover      <-- execution returns here after Baseline JIT compilation
            move r1, sp
            jmp r0, JSEntryPtrTag  <-- jump to JITed code
        .recover:
            loadPC()
        end)
end
Setting a breakpoint at jmp r0, JSEntryPtrTag and inspecting the value of r0 (which is rax), it is observed that it contains the executable address into our JITed code. More specifically the executable address to the start of the compiled loop_hint bytecode.
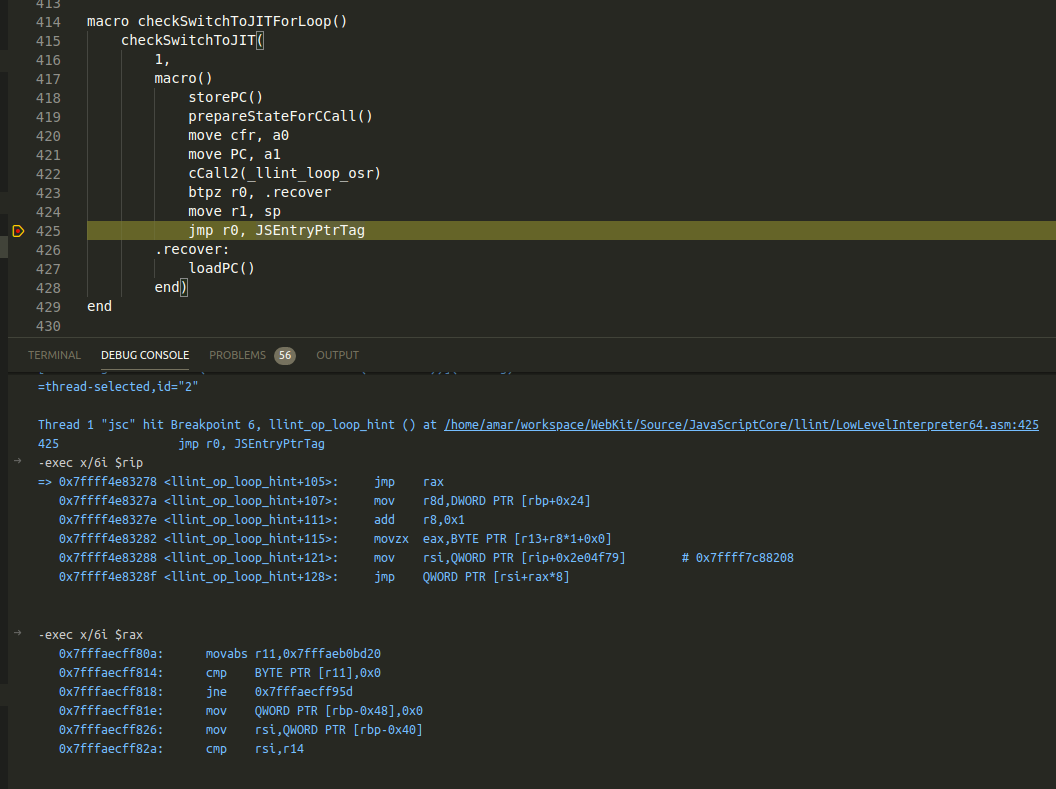
One can enable tracing execution of our compiled code in the Baseline JIT by adding the "--traceBaselineJITExecution=true" flag to launch.json or on the commandline. This will force the Baseline JIT to insert tracing probes in the compiled code. These logging probes will print to stdout:
Optimized <global>#DETOqr:[0x7fffae3c4000->0x7fffeedcb768, LLIntGlobal, 43] with Baseline JIT into 2368 bytes in 1.509752 ms.
JIT generated code for 0x7fffae3c4000 at [0x7fffaecff680, 0x7fffaecfffc0).
    JIT compilation successful.
Installing <global>#DETOqr:[0x7fffae3c4000->0x7fffeedcb768, BaselineGlobal, 43]
JIT [23] op_loop_hint cfr 0x7fffffffcb40 @ <global>#DETOqr:[0x7fffae3c4000->0x7fffeedcb768, BaselineGlobal, 43]
JIT [24] op_check_traps cfr 0x7fffffffcb40 @ <global>#DETOqr:[0x7fffae3c4000->0x7fffeedcb768, BaselineGlobal, 43]
JIT [25] op_mov cfr 0x7fffffffcb40 @ <global>#DETOqr:[0x7fffae3c4000->0x7fffeedcb768, BaselineGlobal, 43]
JIT [28] op_add cfr 0x7fffffffcb40 @ <global>#DETOqr:[0x7fffae3c4000->0x7fffeedcb768, BaselineGlobal, 43]
JIT [34] op_inc cfr 0x7fffffffcb40 @ <global>#DETOqr:[0x7fffae3c4000->0x7fffeedcb768, BaselineGlobal, 43]
JIT [37] op_jless cfr 0x7fffffffcb40 @ <global>#DETOqr:[0x7fffae3c4000->0x7fffeedcb768, BaselineGlobal, 43]
JIT [41] op_end cfr 0x7fffffffcb40 @ <global>#DETOqr:[0x7fffae3c4000->0x7fffeedcb768, BaselineGlobal, 43]
Profiling Tiers
As bytecode is executed in the LLInt and in the Baseline JIT tier, the two JIT tiers gather profile data on the bytecodes being executed which is then propagated to the higher optimising JIT tiers (i.e. DFG and FTL). Profiling aids in speculative compilation3 which is a key aspect of JIT engine optimisations. The Profiling section3 of the WebKit blog does an excellent job of describing the need for profiling, the philosophy behind JavaScriptCore’s profiling goals and details on profiling implementation in the two profiling tiers. It is recommended that the reader first familiarise themselves with this before continuing with the rest of this section.
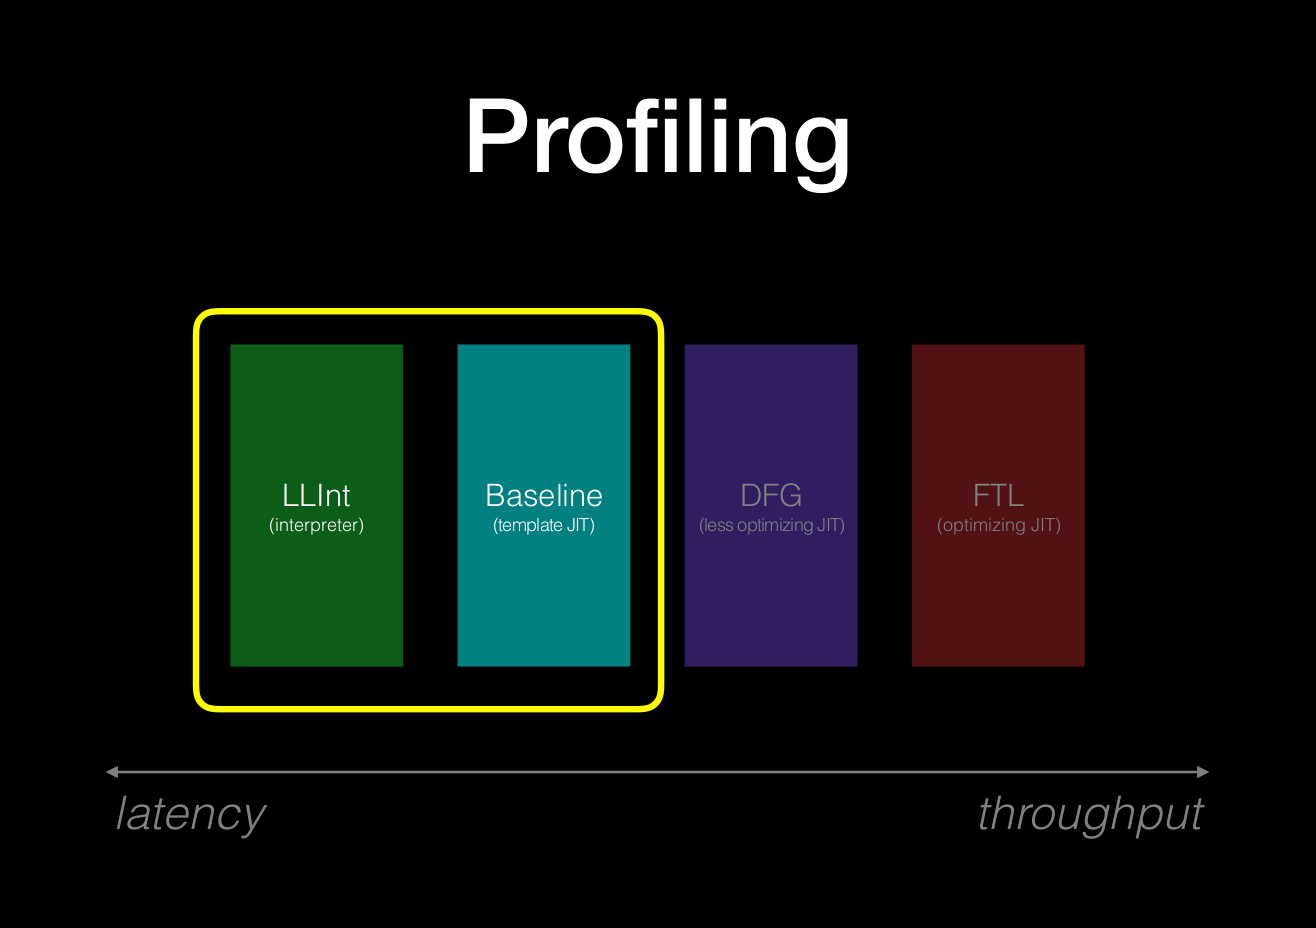
To re-iterate, the key design goals of profiling in JavaScriptCore are summarised in the excerpt below3:
- Profiling needs to focus on noting counterexamples to whatever speculations we want to do. We don’t want to speculate if profiling tells us that the counterexample ever happened, since if it ever happened, then the effective value of this speculation is probably negative. This means that we are not interested in collecting probability distributions. We just want to know if the bad thing ever happened.
- Profiling needs to run for a long time. It’s common to wish for JIT compilers to compile hot functions sooner. One reason why we don’t is that we need about 3-4 “nines” of confidence that that the counterexamples didn’t happen. Recall that our threshold for tiering up into the DFG is about 1000 executions. That’s probably not a coincidence.
Profiling Sources
The profiling tier gathers profiling data from six main sources these are listed as follows3:
- Case Flags – support branch speculation
- Case Counts – support branch speculation
- Value Profiling – type inference of values
- Inline Caches – type inference of object structure
- Watchpoints – support heap speculation
- Exit Flags – support speculation backoff
Case Flags aid branch speculation and the engine uses bit flags to determine if a branch was taken and speculate accordingly. Case Counts are a legacy version of Case Flags where instead of setting a bit flag, it would count the number of times a branch was taken. This approach proved less optimal (details of which are discussed in the webkit blog3) and with a few exceptions this profiling method has largely been made obsolete. Tracing the add opcode is good exercise in exploring how Case Flags function.
Value profiling is the most common profiling method used by JavaScriptCore. Since JavaScript is a dynamic language, JavaScriptCore needs a way to infer the runtime types of the raw values (e.g. integers, doubles, strings, objects, etc) being used by the program. In order to do this JavaScriptCore encode raw values by a process called NaN-boxing which allows the engine to infer the type of data being operated on. This encoding mechanism is documented in JavaScriptJSValue.h.
Inline Caches play a huge role not only in speculative compilation but also in optimising property access and function calls. Inline caches allow the engine to infer the type of a value based on the operation that was performed (e.g. property access and function calls). Discussing the subject of Inline caches would take a blog post in itself and indeed the webkit blog3 devotes a fair chunk of it to discussing Inline Caches in great detail and the speculation it allows JavaScriptCore to perform. It is highly recommended that the reader take the time to explore Inline Caches as an exercise.
Both Watchpoints and Exit Flags become more relevant when exploring the optimising tiers in later parts of this blog series. For the moment it is sufficient to briefly describe them as defined in the webkit blog3:
A watchpoint in JavaScriptCore is nothing more than a mechanism for registering for notification that something happened. Most watchpoints are engineered to trigger only the first time that something bad happens; after that, the watchpoint just remembers that the bad thing had ever happened.
watchpoints let inline caches and the speculative compilers fold certain parts of the heap’s state to constants by getting a notification when things change.
Previous this post touched upon Exit counts briefly in the Tiering Up section of the LLInt, Exit flags are functionally similar in the sense that they record why an OSR Exit occurred. The WebKit blog summarise Exit flags as follows:
The exit flags are a check on the rest of the profiler. They are telling the compiler that the profiler had been wrong here before, and as such, shouldn’t be trusted anymore for this code location.
Given the length of this blog post, a conscious decision was made to avoid deep dives into each of these profiling methods. To reiterate a point made earlier, its is recommended that the reader utilise the WebKit blog3 and the debugging methodology demonstrated in this blog to explore the various profiling methods themselves.
JavaScriptCore Profiler
The jsc shell provides a commandline line option to record profiling information for the code being executed, which can then be parsed into a human readable format. This can be achieved by adding the -p <file path to store profile data> to the commandline args. The profiler captures data from the sources mentioned in the previous section and stores them as serialised JSON. This profile data can then be parsed using the display-profiler-output script which allows examining various aspects of the profiled information5 6.
Let’s enable profiling in our debugging environment by adding the -p flag to the commandline arguments. Note this can also be setup by adding the --enableProfiler=true commandline flag and setting up the environment variable JavaScript_PROFILER_PATH to output the profile data. Updating launch.json to enable profile data gathering should be similar to the one below:
{
    "version": "0.2.0",
    "configurations": [
        {
            "name": "(gdb) Launch",
            "type": "cppdbg",
            "request": "launch",
            "program": "/home/amar/workspace/WebKit/WebKitBuild/Debug/bin/jsc",
            "args": [ "--useDFGJIT=false", "-p", "/home/amar/workspace/WebKit/WebKitBuild/Debug/bin/profile_data.json", "/home/amar/workspace/WebKit/WebKitBuild/Debug/bin/test.js"],
            //... truncated for brevity
        }
    ]
}
Let’s now use the following test script to capture some profiling information. The one below will generate value profiling information for the add function:
$ cat test.js

function add(x,y){
    return x+y;
}

let x = 1;

for(let y = 0; y < 1000; y++){
    add(x,y)
}
In the snippet above the add function takes two arguments x and y. This function is called several times in the for loop to trigger Baseline JIT optimisation. From static inspection of the js code above we can determine that the arguments x and y are going to be Int32 values. Now let’s review the profile data collected for the js code above with display-profiler-output:
~/workspace/WebKit$ ./Tools/Scripts/display-profiler-output ./WebKitBuild/Debug/bin/profile_data.json

   CodeBlock    #Instr  Source Counts         Machine Counts      #Compil  Inlines     #Exits      Last Opts    Source
                       Base/DFG/FTL/FTLOSR  Base/DFG/FTL/FTLOSR                       Src/Total   Get/Put/Call
  add#DzQYpR      15      967/0/0/0             967/0/0/0               1    0/0       0             0/0/0     function add(x,y){ return x+y; }
<global>#D5ICt4  116      506/0/0/0             506/0/0/0               1    0/0       0             0/0/0     function add(x,y){ return x+y; } let x = 1; for(let y = 0; y < 1000; y++){ add(x,y) }
>
This prints statistics on the execution counts of the various codeblocks that were generated, the number compilations that occurred, Exit counts, etc. It also drops into a prompt that allows us to query additional information on the profile data gathered. The help command outputs the various supported options:
> help
summary (s)     Print a summary of code block execution rates.
full (f)        Same as summary, but prints more information.
source          Show the source for a code block.
bytecode (b)    Show the bytecode for a code block, with counts.
profiling (p)   Show the (internal) profiling data for a code block.
log (l)         List the compilations, exits, and jettisons involving this code block.
events (e)      List of events involving this code block.
display (d)     Display details for a code block.
inlines         Show all inlining stacks that the code block was on.
counts          Set whether to show counts for 'bytecode' and 'display'.
sort            Set how to sort compilations before display.
help (h)        Print this message.
quit (q)        Quit.
>
To output the profiling data collected for the codeblock use the profiling command:
> p DzQYpR
Compilation add#DzQYpR-1-Baseline:
      arg0: predicting OtherObj
      arg1: predicting BoolInt32
      arg2: predicting NonBoolInt32
        [   0] enter
        [   1] get_scope          loc4
        [   3] mov                loc5, loc4
        [   6] check_traps
        [   7] add                loc6, arg1, arg2, OperandTypes(126, 126)
        [  13] ret                loc6
>
arg1 and arg2 represent the argument variables x and y in our test script. From the snippet above, one can see that the profile information gathered for the two arguments. JavaScriptCore has predicted that that arg1 could either be a Bool or an Int32 value and that arg2 can be a NonBool or an Int32 value.
Let’s attempt to modify the script to supply a mix of argument types to the add function:
$ cat test.js

function add(x,y){
    return x+y;
}

let x = 1.0;

for(let y = 0.1; y < 1000; y++){
    add(x,y)
}
The arguments x and y would now be passed floating point values. Lets re-generate profiling data and examine the predicted values:
~/workspace/WebKit$ ./Tools/Scripts/display-profiler-output ./WebKitBuild/Debug/bin/profile_data.json
   CodeBlock    #Instr  Source Counts       Machine Counts      #Compil  Inlines        #Exits     Last Opts    Source
                       Base/DFG/FTL/FTLOSR Base/DFG/FTL/FTLOSR                        Src/Total   Get/Put/Call
  add#DzQYpR      15      967/0/0/0             967/0/0/0              1       0/0       0          0/0/0        function add(x,y){ return x+y; }
<global>#AYjpyE  116      506/0/0/0             506/0/0/0              1       0/0       0          0/0/0        function add(x,y){ return x+y; } let x = 1.0; for(let y = 0.1; y < 1000; y++){ add(x,y) }
> p DzQYpR
Compilation add#DzQYpR-1-Baseline:
      arg0: predicting OtherObj
      arg1: predicting AnyIntAsDouble
      arg2: predicting NonIntAsDouble
        [   0] enter
        [   1] get_scope          loc4
        [   3] mov                loc5, loc4
        [   6] check_traps
        [   7] add                loc6, arg1, arg2, OperandTypes(126, 126)
        [  13] ret                loc6
>
As seen in the output above the predicted types for x and y are now any AnyIntAsDouble and NonIntAsDouble. The definitions for the various speculated types can be found in SpeculatedType.h which is generated at compile time and is located under <WebKit build directory>/Debug/DerivedSources/ForwardingHeaders/JavaScriptCore/SpeculatedType.h. The table below7 shows the unique speculation types used in JavaScriptCore:
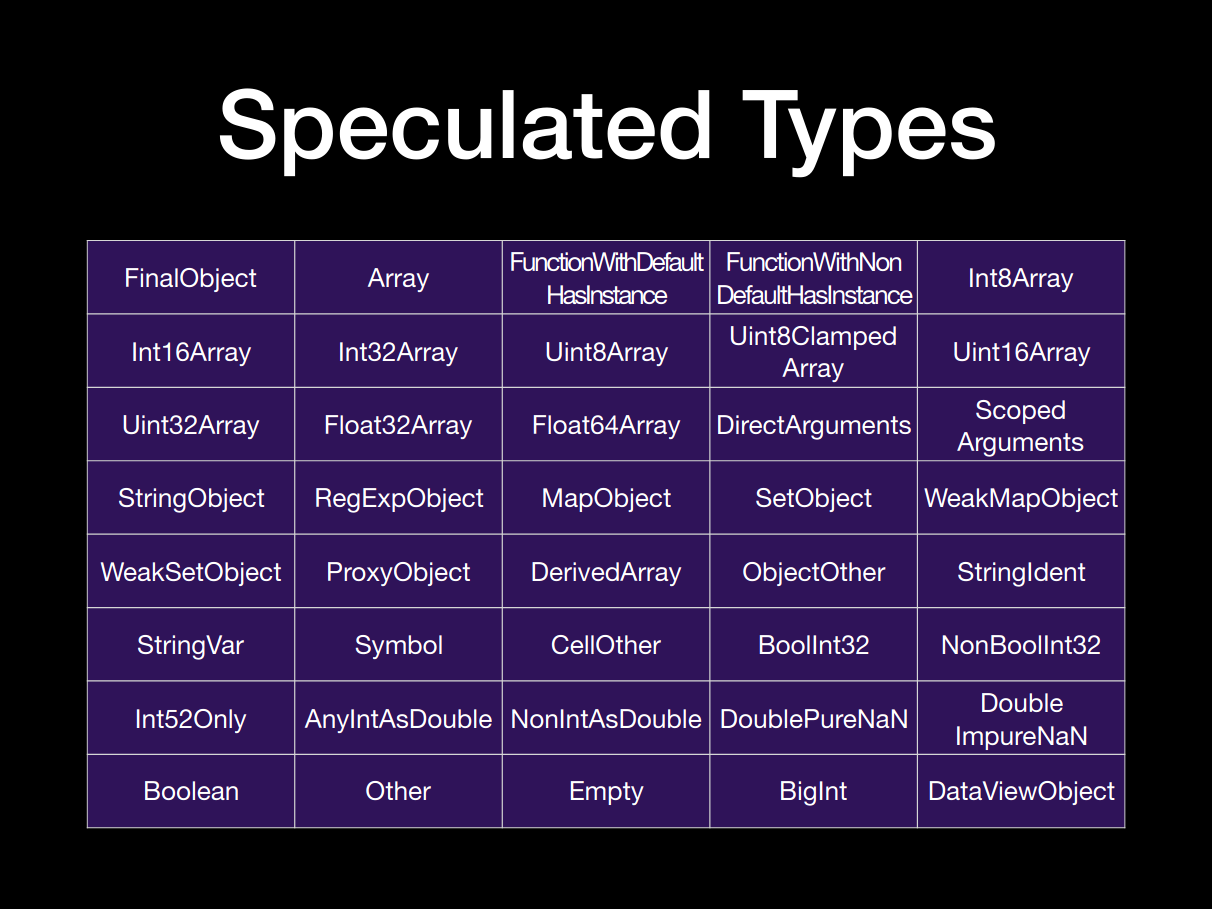
Conclusion
This post explored the LLInt and the Baseling JIT by diving into the details of their implementation and tracing execution of bytecodes in the two tiers. The post also provided an overview of offlineasm assembly and how to understand the LLInt implementation that is written in this assembly. With the understanding of how the LLInt is constructed and how execution in the LLInt works, the post discussed OSR which is the mechanism that allows execution to transition from a lower tier to a higher JIT tier. Finally the blog post concluded by briefly touching upon the subject of profiling bytecode and the various sources used by the engine to gather profiling data.
In Part III of this blog series dives into the details of the Data Flow Graph (DFG). The DFG is the first of two optimising compilers used by JavaScriptCore and the post will explore the process of tiering up from the Baseline JIT into the DFG, the DFG IR and the DFG compiler pipeline.
We hope you’ve found this post informative, if you have questions, spot something that’s incorrect or have suggestions on improving this writeup do reach out to the author @amarekano or @Zon8Research on Twitter. We are more than happy to discuss this at length with anyone interested in this subject and would love to hear your thoughts on it.
Appendix
-
http://www.filpizlo.com/slides/pizlo-speculation-in-jsc-slides.pdf#page=71 ↩︎
-
http://www.filpizlo.com/slides/pizlo-speculation-in-jsc-slides.pdf#page=53 ↩︎
-
https://webkit.org/blog/10308/speculation-in-javascriptcore/ ↩︎ ↩︎ ↩︎ ↩︎ ↩︎ ↩︎ ↩︎ ↩︎ ↩︎ ↩︎ ↩︎ ↩︎ ↩︎
-
http://www.filpizlo.com/slides/pizlo-speculation-in-jsc-slides.pdf#page=64 ↩︎
-
https://docs.google.com/document/d/18MQU5Dm31g4cVweuQuGofQAxfbenAAsE_njeTUuKOVA/edit ↩︎
-
http://somethingkindawierd.com/2015/10/profiling-javascript-in-javascriptcore.html ↩︎
-
http://www.filpizlo.com/slides/pizlo-speculation-in-jsc-slides.pdf#page=216 ↩︎