31 minutes
JavaScriptCore Internals Part V: The DFG (Data Flow Graph) JIT – On Stack Replacement
Introduction
This blog post concludes this review of the DFG with a discussion on the final two stages of the optimisation pipeline: Code generation and OSR. This post begins by examining how an optimised DFG graph is lowered to machine code and how one can inspect the generated machine code. Finally, the blog covers OSR Entry and OSR Exit to and from this optimised compiled code.
Graph Compilation
To begin exploring graph compilation, consider the following JavaScript program and the function jitMe that will be compiled with in the DFG:
function jitMe(x,y) {
    return x + y
}

let x = 1;

for (let y = 0; y < 1000; y++) {
    jitMe(x,y)
}
The function jitMe is executed in a loop over a thousand iterations to trigger DFG optimisation and generation of a DFG graph that is then optimised by running it through the optimisation phases described in Part IV.
Code Generation
Once an optimised graph has been generated for the function jitMe, it’s now time to lower this to machine code. Let’s continue our inspection in DFG::Plan::compileInThreadImpl after the optimisation phases:
JITCompiler dataFlowJIT(dfg);
if (m_codeBlock->codeType() == FunctionCode)
    dataFlowJIT.compileFunction();
else
dataFlowJIT.compile();
First a JITCompiler object is initialised using the optimised graph. This sets up references to the CodeBlock, the optimised graph, a pointer to JIT memory and a reference to the JSC vm. The JITCompiler constructor is listed below:
JITCompiler::JITCompiler(Graph& dfg)
    : CCallHelpers(dfg.m_codeBlock)
    , m_graph(dfg)
    , m_jitCode(adoptRef(new JITCode()))
    , m_blockHeads(dfg.numBlocks())
    , m_pcToCodeOriginMapBuilder(dfg.m_vm)
{
//... code truncated for brevity.
}
With the JITCompiler initialised, the next step is to compile the dfg to machine code. This is done by calling one of two functions. If the CodeBlock being compiled is a JS Function, the function JITCompiler::compileFunction is called. For all other CodeBlock types, the JITCompiler::compile function is called. In our example above, the goal is to compile the jitMe function in the DFG and that leads to the call to compileFunction:
void JITCompiler::compileFunction()
{
    // === Function header code generation ===
    //... code truncated for brevity

    // === Function body code generation ===
    m_speculative = makeUnique<SpeculativeJIT>(*this);
    compileBody();
    setEndOfMainPath();

    // === Function footer code generation ===
    //... code truncated for brevity

    // Generate slow path code.
    m_speculative->runSlowPathGenerators(m_pcToCodeOriginMapBuilder);
    m_pcToCodeOriginMapBuilder.appendItem(labelIgnoringWatchpoints(), PCToCodeOriginMapBuilder::defaultCodeOrigin());

    compileExceptionHandlers();
    linkOSRExits();

    // Create OSR entry trampolines if necessary.
    m_speculative->createOSREntries();
    setEndOfCode();

    // === Link ===
    auto linkBuffer = makeUnique<LinkBuffer>(*this, m_codeBlock, JITCompilationCanFail);
    if (linkBuffer->didFailToAllocate()) {
        m_graph.m_plan.setFinalizer(makeUnique<FailedFinalizer>(m_graph.m_plan));
        return;
    }
    link(*linkBuffer);
    m_speculative->linkOSREntries(*linkBuffer);

    //... code truncated for brevity

    MacroAssemblerCodePtr<JSEntryPtrTag> withArityCheck = linkBuffer->locationOf<JSEntryPtrTag>(arityCheck);

    m_graph.m_plan.setFinalizer(makeUnique<JITFinalizer>(
        m_graph.m_plan, m_jitCode.releaseNonNull(), WTFMove(linkBuffer), withArityCheck));
}
This function begins by emitting code for the function header, this involves saving frame preservation, stack pointer adjustments to accommodate local variables and other function prologue activities. This is then followed by instantiating the SpeculativeJIT and initiating compilation using this instance:
// === Function body code generation ===
m_speculative = makeUnique<SpeculativeJIT>(*this);
compileBody();
The function JITCompiler::compileBody listed above ends up calling SpeculativeJIT::compile which loops over the blocks in the DFG and emits machine code for each of them. Once this compilation is completed, it then links the various blocks to complete the compilation:
bool SpeculativeJIT::compile()
{
    checkArgumentTypes();

    ASSERT(!m_currentNode);
    for (BlockIndex blockIndex = 0; blockIndex < m_jit.graph().numBlocks(); ++blockIndex) {
        m_jit.setForBlockIndex(blockIndex);
        m_block = m_jit.graph().block(blockIndex);
        compileCurrentBlock();
    }
    linkBranches();
    return true;
}
The function compileCurrentBlock iterates over each node in the block and invokes the function SpeculativeJIT::compile(Node*) on each node:
void SpeculativeJIT::compile(Node* node)
{
    NodeType op = node->op();

    //... code truncated for brevity

    switch (op) {
    case JSConstant:
    case DoubleConstant:
    //... code truncated for brevity

    case GetLocal: {
        AbstractValue& value = m_state.operand(node->operand());

        // If the CFA is tracking this variable and it found that the variable
        // cannot have been assigned, then don't attempt to proceed.
        if (value.isClear()) {
            m_compileOkay = false;
            break;
        }

        switch (node->variableAccessData()->flushFormat()) {
        case FlushedDouble: {
            //... code truncated for brevity
            break;
        }

        case FlushedInt32: {
            GPRTemporary result(this);
            m_jit.load32(JITCompiler::payloadFor(node->machineLocal()), result.gpr());

            // Like strictInt32Result, but don't useChildren - our children are phi nodes,
            // and don't represent values within this dataflow with virtual registers.
            VirtualRegister virtualRegister = node->virtualRegister();
            m_gprs.retain(result.gpr(), virtualRegister, SpillOrderInteger);
            generationInfoFromVirtualRegister(virtualRegister).initInt32(node, node->refCount(), result.gpr());
            break;
        }

        case FlushedInt52: {
            //... code truncated for brevity
            break;
        }

        default:
            //... code truncated for brevity
        }
        break;
    }

    case MovHint: {
        compileMovHint(m_currentNode);
        noResult(node);
        break;
    }

    //... code truncated for brevity

    case ArithAdd:
        compileArithAdd(node);
        break;

    //... code turncated for brevity
    }
}
From the snippet above, one can see that each node is filtered through a switch case and depending on the node type, a set of actions is selected to compile the node. Let’s attempt to trace the code generated for the following nodes, generated from parsing and optimising our test script:
function jitMe(x,y) {
    return x + y
}

let x = 1;

for (let y = 0; y < 1000; y++) {
    jitMe(x,y)
}
A truncated version of the final optimised graph and the nodes that compilation will be traced for are listed below:
D@28:<!1:loc5> GetLocal(Check:Untyped:D@1, JS|MustGen|UseAsOther, BoolInt32, arg1(B<BoolInt32>/FlushedInt32), machine:arg1, R:Stack(arg1), bc#7, ExitValid)  predicting BoolInt32
D@29:<!1:loc6> GetLocal(Check:Untyped:D@2, JS|MustGen|UseAsOther, NonBoolInt32, arg2(C<Int32>/FlushedInt32), machine:arg2, R:Stack(arg2), bc#7, ExitValid)  predicting NonBoolInt32
D@30:<!2:loc6> ArithAdd(Int32:D@28, Int32:D@29, JS|MustGen|UseAsOther, Int32, CheckOverflow, Exits, bc#7, ExitValid)
A couple useful flags that help with tracing compilation and code generation are listed below:
-
verboseCompilation: This enables printing compilation information form the SpeculativeJIT as each node is compiled. -
dumpDFGDisassembly: This enables dumping of compiled code for each node at the end of the code generation stage.
These should be enabled in launch.json. Returning back to our discussion of SpeculativeJIT::compile(Node*), lets set a breakpoint at the GetLocal switch case and step through the generation of machine code. With the verboseCompilation flag enabled one should see logging similar to the output below:
SpeculativeJIT generating Node @0 (0) at JIT offset 0x209
SpeculativeJIT generating Node @1 (0) at JIT offset 0x226
SpeculativeJIT generating Node @2 (0) at JIT offset 0x243

//... truncated for brevity

SpeculativeJIT generating Node @31 (7) at JIT offset 0x746
SpeculativeJIT generating Node @33 (13) at JIT offset 0x763
SpeculativeJIT generating Node @34 (13) at JIT offset 0x793
Bailing compilation.
Let’s examine node D@30, from the graph dump listed previously, which is an ArithAdd node. Compiling this node results in a call to compileArithAdd(Node*):
void SpeculativeJIT::compileArithAdd(Node* node)
{
    switch (node->binaryUseKind()) {
    case Int32Use: {
        ASSERT(!shouldCheckNegativeZero(node->arithMode()));

        if (node->child2()->isInt32Constant()) {
            //... code truncated for brevity
        }

        SpeculateInt32Operand op1(this, node->child1());
        SpeculateInt32Operand op2(this, node->child2());
        GPRTemporary result(this, Reuse, op1, op2);

        GPRReg gpr1 = op1.gpr();
        GPRReg gpr2 = op2.gpr();
        GPRReg gprResult = result.gpr();

        if (!shouldCheckOverflow(node->arithMode()))
            m_jit.add32(gpr1, gpr2, gprResult);
        else {
            MacroAssembler::Jump check = m_jit.branchAdd32(MacroAssembler::Overflow, gpr1, gpr2, gprResult);

            if (gpr1 == gprResult && gpr2 == gprResult)
                speculationCheck(Overflow, JSValueRegs(), nullptr, check, SpeculationRecovery(SpeculativeAddSelf, gprResult, gpr2));
            else if (gpr1 == gprResult)
                speculationCheck(Overflow, JSValueRegs(), nullptr, check, SpeculationRecovery(SpeculativeAdd, gprResult, gpr2));
            else if (gpr2 == gprResult)
                speculationCheck(Overflow, JSValueRegs(), nullptr, check, SpeculationRecovery(SpeculativeAdd, gprResult, gpr1));
            else
                speculationCheck(Overflow, JSValueRegs(), nullptr, check);
        }

        strictInt32Result(gprResult, node);
        return;
    }

    //... code truncated for brevity
}
The function above first generates SpeculateInt32Operand objects for the two operands of the addition operation. It then extracts the general purpose registers for these two operands as well as the gpr of the result. Next it performs a check to determine if the addition would cause an overflow. From the optimisation phases, it was determined that the ArithAdd operation is unchecked and does not need checks for overflows. This results in a call to add32 which is defined in MacroAssemblerX86Common.h.
void add32(RegisterID a, RegisterID b, RegisterID dest)
    {
        x86Lea32(BaseIndex(a, b, TimesOne), dest);
    }

    void x86Lea32(BaseIndex index, RegisterID dest)
    {
        if (!index.scale && !index.offset) {
            if (index.base == dest) {
                add32(index.index, dest);
                return;
            }
            if (index.index == dest) {
                add32(index.base, dest);
                return;
            }
        }
        m_assembler.leal_mr(index.offset, index.base, index.index, index.scale, dest);
    }
The functions above then invoke the assembler which results in the generation of the following machine code:
D@30:<!2:loc6>    ArithAdd(Int32:D@28, Int32:D@29, JS|MustGen|UseAsOther, Int32, CheckOverflow, Exits, bc#7, ExitValid)
          0x7fffeecfeb1a: mov $0x7fffaeb0bba0, %r11
          0x7fffeecfeb24: mov (%r11), %r11
          0x7fffeecfeb27: test %r11, %r11
          0x7fffeecfeb2a: jz 0x7fffeecfeb37
          0x7fffeecfeb30: mov $0x113, %r11d
          0x7fffeecfeb36: int3
          0x7fffeecfeb37: mov $0x7fffaeb000e4, %r11
          0x7fffeecfeb41: mov $0xf0f4, (%r11)
          0x7fffeecfeb48: add %esi, %eax
          0x7fffeecfeb4a: jo 0x7fffeecfedd2
          0x7fffeecfeb50: mov $0xffffffff, %r11
          0x7fffeecfeb5a: cmp %r11, %rax
          0x7fffeecfeb5d: jbe 0x7fffeecfeb6a
          0x7fffeecfeb63: mov $0x32, %r11d
          0x7fffeecfeb69: int3
In this fashion, each block and node in each block are compiled to machine code. One can evaluate compilation for each node type by adding breakpoints at the various case statements within compile(Node*) as demonstrate for GetLocal and ArithAdd.
At the end of this compilation, execution returns back to SpeculativeJIT::compile which then calls linkBranches. This function as the name suggests links the various blocks in the graph by iterating over the branches that have been generated as part node compilation and linking them to the corresponding blocks:
void SpeculativeJIT::linkBranches()
{
    for (auto& branch : m_branches)
        branch.jump.linkTo(m_jit.blockHeads()[branch.destination->index], &m_jit);
}
The current test script, test.js does not contain any branching instructions such as loops or if-else statements but one can generate a test script with branching instructions as demonstrated in DFG IR section on branching.
After linkBranches completes and through a series of returns, execution ends up back in JITCompiler::compileFunction at the start of the footer code generation. The snippet of the function listed below performs four main tasks. It performs a number of checks on stack overflows and an arity check if required. An arity check ensures that the correct number of arguments is passed to the CodeBlock before execution of the optimised code.
    // === Function footer code generation ===
    //
    // Generate code to perform the stack overflow handling (if the stack check in
    // the function header fails), and generate the entry point with arity check.

    //... truncated for brevity
    Call callArityFixup;
    Label arityCheck;
    bool requiresArityFixup = m_codeBlock->numParameters() != 1;
    if (requiresArityFixup) {
        arityCheck = label();
        compileEntry();

        load32(AssemblyHelpers::payloadFor((VirtualRegister)CallFrameSlot::argumentCountIncludingThis), GPRInfo::regT1);
        branch32(AboveOrEqual, GPRInfo::regT1, TrustedImm32(m_codeBlock->numParameters())).linkTo(fromArityCheck, this);
        emitStoreCodeOrigin(CodeOrigin(BytecodeIndex(0)));
        //... code truncated for brevity
    } else
        arityCheck = entryLabel;

    //... truncated for brevity
Slow Path Generation and OSR Linking
Once the various nodes in the graph have been lowered to machine code, the next step in the code generation phase is to emit slow path code, link the optimised code to OSR Exit sites and finally creates OSR Entries into the optimised code.
    // Generate slow path code.
    m_speculative->runSlowPathGenerators(m_pcToCodeOriginMapBuilder);
    m_pcToCodeOriginMapBuilder.appendItem(labelIgnoringWatchpoints(), PCToCodeOriginMapBuilder::defaultCodeOrigin());

    compileExceptionHandlers();
    linkOSRExits();

    // Create OSR entry trampolines if necessary.
    m_speculative->createOSREntries();
    setEndOfCode();
Slow Paths are generated for operations that require additional checks that the DFG cannot optimise out. Examples of JavaScript constructs that generate slow paths are array push operations, array slice operations, Calling toObject or an object constructor, etc. The function runSlowPathGenerators is listed below:
void SpeculativeJIT::runSlowPathGenerators(PCToCodeOriginMapBuilder& pcToCodeOriginMapBuilder)
{
    for (auto& slowPathGenerator : m_slowPathGenerators) {
        pcToCodeOriginMapBuilder.appendItem(m_jit.labelIgnoringWatchpoints(), slowPathGenerator->origin().semantic);
        slowPathGenerator->generate(this);
    }
    for (auto& slowPathLambda : m_slowPathLambdas) {
        Node* currentNode = slowPathLambda.currentNode;
        m_currentNode = currentNode;
        m_outOfLineStreamIndex = slowPathLambda.streamIndex;
        pcToCodeOriginMapBuilder.appendItem(m_jit.labelIgnoringWatchpoints(), currentNode->origin.semantic);
        slowPathLambda.generator();
        m_outOfLineStreamIndex = WTF::nullopt;
    }
}
The snippet above, lists two loops, one that iterates over m_slowPathGenerators and the other over m_slowPathLambdas. In the first loop for each slowPathGenerator, the generate function is invoked which through a series of function calls ends up calling CallResultAndArgumentsSlowPathGenerator::unpackAndGenerate:
void unpackAndGenerate(SpeculativeJIT* jit, std::index_sequence<ArgumentsIndex...>)
    {
        this->setUp(jit);
        if constexpr (std::is_same<ResultType, NoResultTag>::value)
            this->recordCall(jit->callOperation(this->m_function, std::get<ArgumentsIndex>(m_arguments)...));
        else
            this->recordCall(jit->callOperation(this->m_function, extractResult(this->m_result), std::get<ArgumentsIndex>(m_arguments)...));
        this->tearDown(jit);
    }
In the snippet above, the function begins by calling setUp which emits code that generates jump instructions from the JIT code to the slow path call. It then invokes the function callOperation which emits machine code for the specific slow path call identified by m_function. Finally, once callOperation returns, the call to tearDown generates jump instructions from the slow path back into the JIT code. One of the design principles of slow paths is that they are shared across the four JSC tiers and can be accessed via the JIT ABI.
Once code for slow paths have been generated, the various OSR Exits are linked with the call to linkOSRExits. The essentially loops over the OSR Exit sites that have been recorded at the time of graph generation and uses this information to generate jump instructions from the JIT code to a OSR Exit handler. The OSR Exit section of this blog will cover how these exits are handled in further detail.
Finally, a call to createOSREntries which loops over the list of blocks in the graph and identifies blocks that are either OSR Entry targets or entry points to Catch blocks to generate a list of OSR Entry points that will be linked as part of the final stage of compilation.
Code Linking
Following the code generation stage, execution reaches the end of the JITCompiler::compileFunction which is the final stage of the JIT compilation and does the linking and finalisation of the compilation process:
    //... code truncated for brevity

    // === Link ===
    auto linkBuffer = makeUnique<LinkBuffer>(*this, m_codeBlock, JITCompilationCanFail);
    if (linkBuffer->didFailToAllocate()) {
        m_graph.m_plan.setFinalizer(makeUnique<FailedFinalizer>(m_graph.m_plan));
        return;
    }
    link(*linkBuffer);
    m_speculative->linkOSREntries(*linkBuffer);

    if (requiresArityFixup)
        linkBuffer->link(callArityFixup, FunctionPtr<JITThunkPtrTag>(vm().getCTIStub(arityFixupGenerator).code()));

    disassemble(*linkBuffer);

    MacroAssemblerCodePtr<JSEntryPtrTag> withArityCheck = linkBuffer->locationOf<JSEntryPtrTag>(arityCheck);

    m_graph.m_plan.setFinalizer(makeUnique<JITFinalizer>(
        m_graph.m_plan, m_jitCode.releaseNonNull(), WTFMove(linkBuffer), withArityCheck));
}
The function first allocates memory of the LinkBuffer and retrieves a pointer to this object. It then calls the function JITCompiler::link which performs a number of linking operations on the LinkBuffer. These operations include linking switch statements, function calls within the optimised code and from the optimised code to external targets (e.g. stack overflow checks, arity checks, etc), inline cache accesses, OSR Exit targets and finally any exception handlers generated by the DFG.
Once the JITCompiler::link function returns, the call the function SpeculativeJIT::linkOSREntries(LinkBuffer& linkBuffer) is invoked. This function loops over each block in the graph to determine if the block is an OSR Entry Target and makes a record of it. With the verboseCompilation flag enabled, you should be able to see the various OSR Entry sites printed to stdout. For example, the OSR entries generated for test script test.js are listed below:
OSR Entries:
    bc#0, machine code = 0x7fffeecfe917, stack rules = [arg2:(Int32, none:StructuresAreClobbered) (maps to arg2), arg1:(Int32, none:StructuresAreClobbered) (maps to arg1), arg0:(BytecodeTop, TOP, TOP, none:StructuresAreClobbered) (maps to this), loc0:(BytecodeTop, TOP, TOP, none:StructuresAreClobbered) (ignored), loc1:(BytecodeTop, TOP, TOP, none:StructuresAreClobbered) (ignored), loc2:(BytecodeTop, TOP, TOP, none:StructuresAreClobbered) (ignored), loc3:(BytecodeTop, TOP, TOP, none:StructuresAreClobbered) (ignored), loc4:(BytecodeTop, TOP, TOP, none:StructuresAreClobbered) (ignored), loc5:(BytecodeTop, TOP, TOP, none:StructuresAreClobbered) (ignored), loc6:(BytecodeTop, TOP, TOP, none:StructuresAreClobbered) (ignored), loc7:(BytecodeTop, TOP, TOP, none:StructuresAreClobbered) (ignored)], machine stack used = ---------------------------------------------------------------
The function that dumps the various OSR entries is OSREntryData::dumpInContext. Setting a break point at this function will allow inspection of the individual fields on the OSR Entry site.
Lastly a JITFinalizer is initialised which takes four arguments: a reference to the optimised graph, a reference to the JIT memory for the CodeBlock, a reference to the LinkBuffer which contains the DFG compiled code and finally an entry pointer into the LinkBuffer (i.e. withArityCheck).
m_graph.m_plan.setFinalizer(makeUnique<JITFinalizer>(
        m_graph.m_plan, m_jitCode.releaseNonNull(), WTFMove(linkBuffer), withArityCheck));
The JITFinalizer sets up pointer references from the CodeBlock to the JIT code located in the linkBuffer and other housekeeping activities. At this point in the compilation phase one can dump all the DFG generated optimised code to stdout by enabling the --dumpDFGDisassembly=true flag. An example of what the disassembly dump would look like is listed below:
Generated DFG JIT code for jitMe#Dsl1pz:[0x7fffae3c4260->0x7fffae3c4130->0x7fffae3e5100, DFGFunctionCall, 15], instructions size = 15:
    Optimized with execution counter = 1005.000000/1072.000000, 5
    Code at [0x7fffeecfe880, 0x7fffeecfee00):
          0x7fffeecfe880: push %rbp
          0x7fffeecfe881: mov %rsp, %rbp
          0x7fffeecfe884: mov $0x7fffae3c4260, %r11

//... truncated for brevity

          0x7fffeecfe8ed: cmp %r14, 0x38(%rbp)
          0x7fffeecfe8f1: jb 0x7fffeecfed84
    Block #0 (bc#0): (OSR target)
      Execution count: 1.000000
      Predecessors:
      Successors:
      Dominated by: #root #0
      Dominates: #0
      Dominance Frontier:
      Iterated Dominance Frontier:
          0x7fffeecfe8f7: test $0x7, %bpl
          0x7fffeecfe8fb: jz 0x7fffeecfe908
          0x7fffeecfe901: mov $0xa, %r11d

//... truncated for brevity

          0x7fffeecfe950: int3
       D@0:< 1:->       SetArgumentDefinitely(IsFlushed, this(a), machine:this, W:SideState, bc#0, ExitValid)  predicting OtherObj
          0x7fffeecfe951: mov $0x7fffaeb000e4, %r11
          0x7fffeecfe95b: mov $0x94, (%r11)
       D@1:< 2:->       SetArgumentDefinitely(IsFlushed, arg1(B<BoolInt32>/FlushedInt32), machine:arg1, W:SideState, bc#0, ExitValid)  predicting BoolInt32
          0x7fffeecfe962: mov $0x7fffaeb000e4, %r11
          0x7fffeecfe96c: mov $0x894, (%r11)
       D@2:< 2:->       SetArgumentDefinitely(IsFlushed, arg2(C<Int32>/FlushedInt32), machine:arg2, W:SideState, bc#0, ExitValid)  predicting NonBoolInt32
          0x7fffeecfe973: mov $0x7fffaeb000e4, %r11
          0x7fffeecfe97d: mov $0x1094, (%r11)
       D@3:<!0:->       CountExecution(MustGen, 0x7fffeed96190, R:InternalState, W:InternalState, bc#0, ExitValid)
          0x7fffeecfe984: mov $0x7fffaeb000e4, %r11
          0x7fffeecfe98e: mov $0x1d1c, (%r11)
          0x7fffeecfe995: mov $0x7fffeed96190, %r11
          0x7fffeecfe99f: inc (%r11)

//... truncated for brevity

      D@28:<!1:loc5>    GetLocal(Check:Untyped:D@1, JS|MustGen|UseAsOther, BoolInt32, arg1(B<BoolInt32>/FlushedInt32), machine:arg1, R:Stack(arg1), bc#7, ExitValid)  predicting BoolInt32
          0x7fffeecfeaf2: mov $0x7fffaeb000e4, %r11
          0x7fffeecfeafc: mov $0xe03c, (%r11)
          0x7fffeecfeb03: mov 0x30(%rbp), %eax
      D@29:<!1:loc6>    GetLocal(Check:Untyped:D@2, JS|MustGen|UseAsOther, NonBoolInt32, arg2(C<Int32>/FlushedInt32), machine:arg2, R:Stack(arg2), bc#7, ExitValid)  predicting NonBoolInt32
          0x7fffeecfeb06: mov $0x7fffaeb000e4, %r11
          0x7fffeecfeb10: mov $0xe83c, (%r11)
          0x7fffeecfeb17: mov 0x38(%rbp), %esi
      D@30:<!2:loc6>    ArithAdd(Int32:D@28, Int32:D@29, JS|MustGen|UseAsOther, Int32, CheckOverflow, Exits, bc#7, ExitValid)
          0x7fffeecfeb1a: mov $0x7fffaeb0bba0, %r11
          0x7fffeecfeb24: mov (%r11), %r11
          0x7fffeecfeb27: test %r11, %r11
          0x7fffeecfeb2a: jz 0x7fffeecfeb37
          0x7fffeecfeb30: mov $0x113, %r11d
          0x7fffeecfeb36: int3

//... truncated for brevity

    (End Of Main Path)
          0x7fffeecfebf4: mov $0x0, 0x24(%rbp)
          0x7fffeecfebfb: mov $0x7fffae3c4260, %rdi
          0x7fffeecfec05: mov $0x7fffaeb09fd8, %r11

//... truncated for brevity

          0x7fffeecfeded: mov $0x3, (%r11)
          0x7fffeecfedf4: jmp 0x7fffaecffc20
    Structures:
        %Bq:JSGlobalLexicalEnvironment = 0x7fffae3f9180:[0xf475, JSGlobalLexicalEnvironment, {}, NonArray, Leaf]
Once compilation and linking has been completed, execution then returns back up the call stack back to Plan::compileInThread after returning from Plan::compileInThreadImpl. On successful compilation and with the reportCompileTimes flag enabled in launch.json one should see the following log statement printed to stdout just before the function Plan::compileInThread returns:
Optimized jitMe#Dsl1pz:[0x7fffae3c4260->0x7fffae3c4130->0x7fffae3e5100, NoneFunctionCall, 15] using DFGMode with DFG into 1408 bytes in 64.088453 ms.
The function compileInThread returns to DFG::compileImpl which invokes the function Plan::finalizeWithoutNotifyingCallback before returning to DFG::compile:
plan->compileInThread(nullptr);
return plan->finalizeWithoutNotifyingCallback();
The function above does two important actions, among a number of validation checks, it first validates that the compilation has succeeded and that the CodeBlock, which was compiled, is still valid. The second most important action is that it invokes the finalizer created earlier which updates the CodeBlocks reference to the JITCode and the entry point to being execution from which is referenced by withArityCheck:
bool JITFinalizer::finalizeFunction()
{
    RELEASE_ASSERT(!m_withArityCheck.isEmptyValue());
    m_jitCode->initializeCodeRefForDFG(
        FINALIZE_DFG_CODE(*m_linkBuffer, JSEntryPtrTag, "DFG JIT code for %s", toCString(CodeBlockWithJITType(m_plan.codeBlock(), JITType::DFGJIT)).data()),
        m_withArityCheck);
    m_plan.codeBlock()->setJITCode(m_jitCode.copyRef());

    finalizeCommon();

    return true;
}
Once these references have been set, the DFG can now notify the engine on where to jump to in order to being execution in the optimised code. The next section will examine how execution transfers from the BaslineJIT into the optimised code generated by the DFG.
Tracing Execution
Having successfully compiled the CodeBlock with the DFG, execution control after the compilation returns to operationOpitmize in JITOperations.cpp:
    //... code truncated for brevity.

        CodeBlock* replacementCodeBlock = codeBlock->newReplacement();
        CompilationResult result = DFG::compile(
            vm, replacementCodeBlock, nullptr, DFG::DFGMode, bytecodeIndex,
            mustHandleValues, JITToDFGDeferredCompilationCallback::create());

        if (result != CompilationSuccessful) {
            CODEBLOCK_LOG_EVENT(codeBlock, "delayOptimizeToDFG", ("compilation failed"));
            return encodeResult(nullptr, nullptr);
        }
    }

    //... code truncated for brevity
Execution now need to jump to the optimised code and this is done via OSR Entry which will be discussed in the next section.
OSR Entry
This begins with the call to prepareOSREntry from operationOptimize which is shown in the snippet below:
CodeBlock* optimizedCodeBlock = codeBlock->replacement();
    ASSERT(optimizedCodeBlock && JITCode::isOptimizingJIT(optimizedCodeBlock->jitType()));

    if (void* dataBuffer = DFG::prepareOSREntry(vm, callFrame, optimizedCodeBlock, bytecodeIndex)) {
        //... truncated for brevity

        void* targetPC = vm.getCTIStub(DFG::osrEntryThunkGenerator).code().executableAddress();
        targetPC = retagCodePtr(targetPC, JITThunkPtrTag, bitwise_cast<PtrTag>(callFrame));
        return encodeResult(targetPC, dataBuffer);
    }
The function prepareOSREntry, determines if it is safe to OSR entry into the optimised code by performing a number of checks. If a check fails the function returns 0 which causes the execution to continue in the Baseline JIT and the tier-up threshold counters are adjusted on account of OSR Entry failing. When all checks pass, it returns a pointer to a dataBuffer that the OSR entry thunk will recognize and parse.
From the snippet above, prepareOSREntry takes four arguments: a reference to the JSC runtime, a reference to the currently executing call frame in the Baseline JIT, a reference to the CodeBlock that’s been optimized by the DFG and the bytecode index at which to OSR Enter.
Stepping into the function, it first gathers information on OSR Entry for the supplied bytecode index:
JITCode* jitCode = codeBlock->jitCode()->dfg();
OSREntryData* entry = jitCode->osrEntryDataForBytecodeIndex(bytecodeIndex);

if (!entry) {
   dataLogLnIf(Options::verboseOSR(), "    OSR failed because the entrypoint was optimized out.");
   return nullptr;
}
If valid OSREntryData was retrieved the function performs various checks to determine if it’s safe to OSR Enter. The developer comments in the source code document the various checks that are performed before OSR Entry. Once the checks pass and the DFG has committed to OSR Entry, the next step is to populate the dataBuffer and other data format conversions:
// 3) Set up the data in the scratch buffer and perform data format conversions.

    unsigned frameSize = jitCode->common.frameRegisterCount;
    unsigned baselineFrameSize = entry->m_expectedValues.numberOfLocals();
    unsigned maxFrameSize = std::max(frameSize, baselineFrameSize);

    Register* scratch = bitwise_cast<Register*>(vm.scratchBufferForSize(sizeof(Register) * (2 + CallFrame::headerSizeInRegisters + maxFrameSize))->dataBuffer());

    *bitwise_cast<size_t*>(scratch + 0) = frameSize;  <-- Frame size added to buffer

    void* targetPC = entry->m_machineCode.executableAddress();  <--- Memory address to optimised machine code at which to OSR Enter
    //... truncated for brevity
    *bitwise_cast<void**>(scratch + 1) = retagCodePtr(targetPC, OSREntryPtrTag, bitwise_cast<PtrTag>(callFrame)); <-- targetPC added to buffer

    Register* pivot = scratch + 2 + CallFrame::headerSizeInRegisters;

    for (int index = -CallFrame::headerSizeInRegisters; index < static_cast<int>(baselineFrameSize); ++index) { <-- Register values added to the buffer
        VirtualRegister reg(-1 - index);

        if (reg.isLocal()) {
            if (entry->m_localsForcedDouble.get(reg.toLocal())) {
                *bitwise_cast<double*>(pivot + index) = callFrame->registers()[reg.offset()].asanUnsafeJSValue().asNumber();
                continue;
            }

            if (entry->m_localsForcedAnyInt.get(reg.toLocal())) {
                *bitwise_cast<int64_t*>(pivot + index) = callFrame->registers()[reg.offset()].asanUnsafeJSValue().asAnyInt() << JSValue::int52ShiftAmount;
                continue;
            }
        }

        pivot[index] = callFrame->registers()[reg.offset()].asanUnsafeJSValue();
    }
The value of targetPC in the snippet above points to the memory address of the first optimised machine code instruction for the compiled bytecode at which the engine will OSR Enter at. This address is added to the buffer along with the various loc values from the current call frame.
This is followed by shuffling temporary locals and cleaning up the call frame of values that aren’t used by the DFG. Once the registers have been aligned in the buffer, the next step is to handle callee saves in the buffer.
// 6) Copy our callee saves to buffer.
#if NUMBER_OF_CALLEE_SAVES_REGISTERS > 0
    const RegisterAtOffsetList* registerSaveLocations = codeBlock->calleeSaveRegisters();
    RegisterAtOffsetList* allCalleeSaves = RegisterSet::vmCalleeSaveRegisterOffsets();
    RegisterSet dontSaveRegisters = RegisterSet(RegisterSet::stackRegisters(), RegisterSet::allFPRs());

    unsigned registerCount = registerSaveLocations->size();
    VMEntryRecord* record = vmEntryRecord(vm.topEntryFrame);
    for (unsigned i = 0; i < registerCount; i++) {
        RegisterAtOffset currentEntry = registerSaveLocations->at(i);
        if (dontSaveRegisters.get(currentEntry.reg()))
            continue;
        RegisterAtOffset* calleeSavesEntry = allCalleeSaves->find(currentEntry.reg());

        if constexpr (CallerFrameAndPC::sizeInRegisters == 2)
            *(bitwise_cast<intptr_t*>(pivot - 1) - currentEntry.offsetAsIndex()) = record->calleeSaveRegistersBuffer[calleeSavesEntry->offsetAsIndex()];
        else {
            // We need to adjust 4-bytes on 32-bits, otherwise we will clobber some parts of
            // pivot[-1] when currentEntry.offsetAsIndex() returns -1. This region contains
            // CallerFrameAndPC and if it is cloberred, we will have a corrupted stack.
            // Also, we need to store callee-save registers swapped in pairs on scratch buffer,
            // otherwise they will be swapped when copied to call frame during OSR Entry code.
            // Here is how we would like to have the buffer configured:
            //
            // pivot[-4] = ArgumentCountIncludingThis
            // pivot[-3] = Callee
            // pivot[-2] = CodeBlock
            // pivot[-1] = CallerFrameAndReturnPC
            // pivot[0]  = csr1/csr0
            // pivot[1]  = csr3/csr2
            // ...
            ASSERT(sizeof(intptr_t) == 4);
            ASSERT(CallerFrameAndPC::sizeInRegisters == 1);
            ASSERT(currentEntry.offsetAsIndex() < 0);

            int offsetAsIndex = currentEntry.offsetAsIndex();
            int properIndex = offsetAsIndex % 2 ? offsetAsIndex - 1 : offsetAsIndex + 1;
            *(bitwise_cast<intptr_t*>(pivot - 1) + 1 - properIndex) = record->calleeSaveRegistersBuffer[calleeSavesEntry->offsetAsIndex()];
        }
    }
#endif
Once the buffer has been successfully populated, execution returns to the calling function operationOptimize.
void* targetPC = vm.getCTIStub(DFG::osrEntryThunkGenerator).code().executableAddress();
targetPC = retagCodePtr(targetPC, JITThunkPtrTag, bitwise_cast<PtrTag>(callFrame));
return encodeResult(targetPC, dataBuffer);
The value of targetPC points to the thunk code generated by DFG::osrEntryThunkGenerator. This is the thunk code that will parse the dataBuffer generated by the function prepareOSREntry and transfer execution control to the optimised machine code pointed to by that buffer. When compilation succeeds and execution return to the BaselineJIT, the BaselineJIT will jump to the thunk code generated and the thunk code will in turn jump to the machine code generated for the bytecode at which OSR Entry will occur.
Let’s now attempt to trace this in our debugger by optimising the function jitMe in the following JavaScript program and OSR entering into the optimised code:
function jitMe(x,y) {
    return x + y
}

let x = 1;

for (let y = 0; y < 1000; y++) {
    jitMe(x,y)
}
OSR Entry occurs at bc#0 and the optimised code generated for this CodeBlock at the bytecode boundary is listed below:
    Block #0 (bc#0): (OSR target)
      Execution count: 1.000000
      Predecessors:
      Successors:
      Dominated by: #root #0
      Dominates: #0
      Dominance Frontier:
      Iterated Dominance Frontier:
          0x7fffeecfe8f7: test $0x7, %bpl  <-- Machine code of bc#0
          0x7fffeecfe8fb: jz 0x7fffeecfe908
          0x7fffeecfe901: mov $0xa, %r11d
          0x7fffeecfe907: int3
          0x7fffeecfe908: mov $0xfffe000000000000, %r11
          0x7fffeecfe912: cmp %r11, %r14
          0x7fffeecfe915: jz 0x7fffeecfe923
          0x7fffeecfe91b: mov $0x82, %r11d
          //... truncated for brevity
In the screenshot below, the debugger is paused at the return statement in operationOptimize and one can inspect the values of targetPC and dataBuffer. Examining the contents of the memory address pointed to by dataBuffer and notice that the second double word value listed is the memory address of the optimised code for block #0 listed in the dump above.
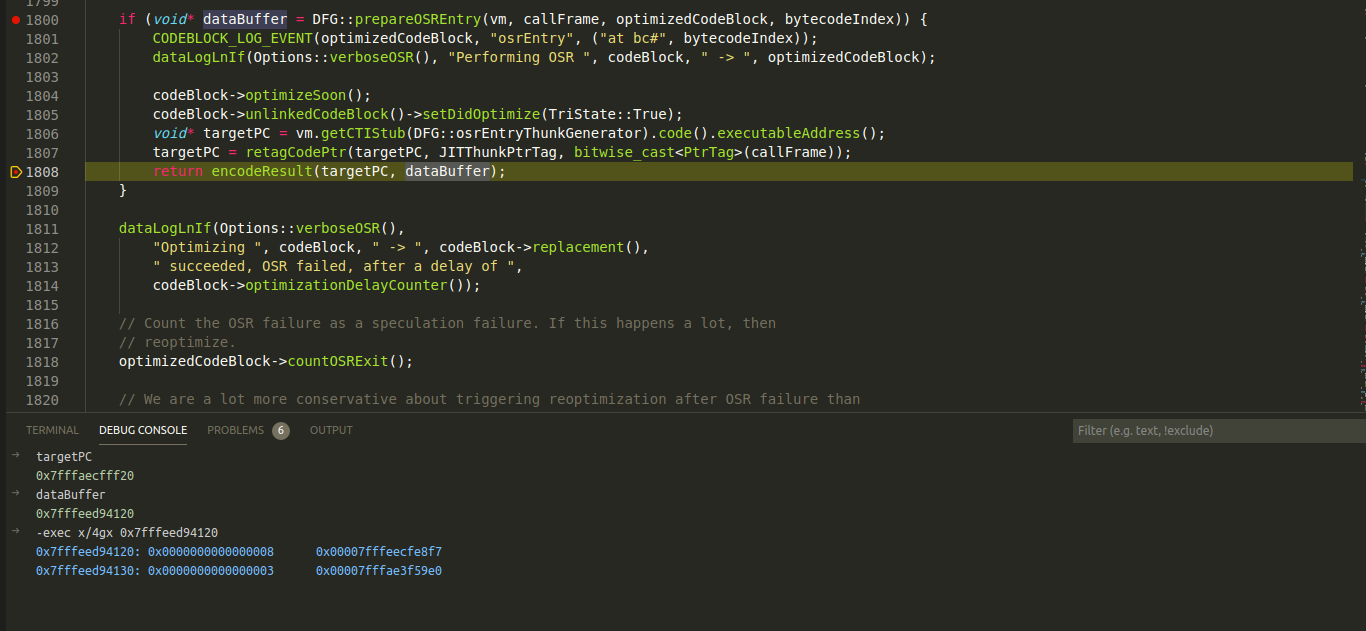
Setting a breakpoint at the memory address listed in the buffer would allow pausing execution at the start of OSR Entry into the optimised code.
OSR Exit
Now let’s consider a scenario when a speculation check fails and it becomes necessary to bail out of the DFG optimised code back to the Baseline JIT or LLInt. First let’s look at how the checks are generated from the DFG and trace execution to compile the bailout code. Consider the following JavaScript program:
function jitMe(x,y) {
    return x + y
}

let x = 1;

for (let y = 0; y < 1000; y++) {
    jitMe(x,y)
}

// Trigger OSR Exit
jitMe("a", "b")
The function jitMe has been optimised to handle integer values for x and y. Supplying non-integer values to the function would could cause the speculation checks on x and y to fail and execution would bail out of the optimised code and run in a lower tier such as the Baseline JIT or the LLInt. Let’s now trace this bailout in our debugger. As we’ve seen in the [Code Generation section], the OSR Exits are implemented as a thunk which is added to the linkBuffer. When a speculation check fails, execution jumps to the OSR Exit thunk which is a trampoline to the function that initiates OSR Exit by reconstructing the callframe and emitting OSR Exit code to transfer execution to a lower tier.
There is a useful helper function that one can add to the target that will let the reader emit breakpoints from JavaScript source which will then be trap in our debugger1. This will help with tracing OSR Exits as they occur.
diff --git a/Source/JavaScriptCore/jsc.cpp b/Source/JavaScriptCore/jsc.cpp
index 1226f84b461d..5f456766e3a8 100644
--- a/Source/JavaScriptCore/jsc.cpp
+++ b/Source/JavaScriptCore/jsc.cpp
@@ -261,6 +261,9 @@ static EncodedJSValue JSC_HOST_CALL functionIsHeapBigInt(JSGlobalObject*, CallFr
 static EncodedJSValue JSC_HOST_CALL functionPrintStdOut(JSGlobalObject*, CallFrame*);
 static EncodedJSValue JSC_HOST_CALL functionPrintStdErr(JSGlobalObject*, CallFrame*);
 static EncodedJSValue JSC_HOST_CALL functionDebug(JSGlobalObject*, CallFrame*);
+
+static EncodedJSValue JSC_HOST_CALL functionDbg(JSGlobalObject*, CallFrame*);
+
 static EncodedJSValue JSC_HOST_CALL functionDescribe(JSGlobalObject*, CallFrame*);
 static EncodedJSValue JSC_HOST_CALL functionDescribeArray(JSGlobalObject*, CallFrame*);
 static EncodedJSValue JSC_HOST_CALL functionSleepSeconds(JSGlobalObject*, CallFrame*);
@@ -488,6 +491,7 @@ private:

         addFunction(vm, "debug", functionDebug, 1);
         addFunction(vm, "describe", functionDescribe, 1);
+        addFunction(vm, "dbg", functionDbg, 0);
         addFunction(vm, "describeArray", functionDescribeArray, 1);
         addFunction(vm, "print", functionPrintStdOut, 1);
         addFunction(vm, "printErr", functionPrintStdErr, 1);
@@ -1277,6 +1281,12 @@ EncodedJSValue JSC_HOST_CALL functionDebug(JSGlobalObject* globalObject, CallFra
     return JSValue::encode(jsUndefined());
 }

+EncodedJSValue JSC_HOST_CALL functionDbg(JSGlobalObject* globalObject, CallFrame* callFrame)
+{
+    asm("int3");
+    return JSValue::encode(jsUndefined());
+}
+
 EncodedJSValue JSC_HOST_CALL functionDescribe(JSGlobalObject* globalObject, CallFrame* callFrame)
 {
     VM& vm = globalObject->vm();
By adding this helper function to jsc, one can invoke this from our test program to pause execution before our call jitMe that triggers the OSR Exit. The test program is updated to include a call to dbg as follows:
function jitMe(x,y) {
    return x + y
}

let x = 1;

for (let y = 0; y < 1000; y++) {
    jitMe(x,y)
}

dbg();

// Trigger OSR Exit
jitMe("a", "b")
The function dbg will now generate an interrupt that will be caught by our debugger before the OSR Exit is triggered when jitMe is called in the next JS instruction. Once the breakpoint is hit, the next step is to add another breakpoint at the start of the optimised code for jitMe. With disassembly dumps enabled, this should be easy to find:
Generated DFG JIT code for jitMe#Dsl1pz:[0x7fffae3c4260->0x7fffae3c4130->0x7fffae3e5100, DFGFunctionCall, 15], instructions size = 15:
    Optimized with execution counter = 1005.000000/1072.000000, 5
    Code at [0x7fffeecfe880, 0x7fffeecfee00):
          0x7fffeecfe880: push %rbp
          0x7fffeecfe881: mov %rsp, %rbp
          0x7fffeecfe884: mov $0x7fffae3c4260, %r11
          0x7fffeecfe88e: mov %r11, 0x10(%rbp)
          0x7fffeecfe892: lea -0x40(%rbp), %rsi
Setting a breakpoint at 0x7fffeecfe880 and stepping through the instructions the following instructions are encountered:
[Switching to thread 2 (Thread 0x7fffef6ed700 (LWP 20434))](running)
=thread-selected,id="2"
0x00007fffeecfe8e3 in ?? ()
-exec x/10i $rip
=> 0x7fffeecfe8e3:  cmp    QWORD PTR [rbp+0x30],r14
   0x7fffeecfe8e7:  jb     0x7fffeecfed5d
   0x7fffeecfe8ed:  cmp    QWORD PTR [rbp+0x38],r14
   0x7fffeecfe8f1:  jb     0x7fffeecfed84
At the memory address pointed to by rbp+0x30 is the value of the first parameter passed to jitMe and at rbp+0x38 lies the second parameter. r14 contains the value 0xfffe000000000000 which is the encoding used for Integer values in JSC. The cmp operations in the snippet above compare the values on the stack (speculated to be integers) with the integer encoding tag. If the values on the stack are less than the value in r14 the jumps to 0x7fffeecfed5d if speculation on the first parameter fails or 0x7fffeecfed5d if speculation on the second parameter fails.
-exec x/4i $rip
=> 0x7fffeecfe8e3:  cmp    QWORD PTR [rbp+0x30],r14
   0x7fffeecfe8e7:  jb     0x7fffeecfed5d
   0x7fffeecfe8ed:  cmp    QWORD PTR [rbp+0x38],r14
   0x7fffeecfe8f1:  jb     0x7fffeecfed84

-exec x/gx $rbp+0x30
0x7fffffffca10: 0x00007fffae3fc5a0

-exec p/x $r14
$2 = 0xfffe000000000000
Execution continues up taking the jump 0x7fffeecfed5d which is a trampoline to the OSRExit thunk at 0x0x7fffaecffc20:
0x00007fffeecfed5d in ?? ()
-exec x/10i $rip
=> 0x7fffeecfed5d:  test   bpl,0x7

//... truncated for brevity

   0x7fffeecfed78:  mov    DWORD PTR [r11],0x0
   0x7fffeecfed7f:  jmp    0x7fffaecffc20
The OSRExit thunk ends up calling operationCompileOSRExit which begins the process of compiling an OSR Exit:
void JIT_OPERATION operationCompileOSRExit(CallFrame* callFrame)
{
    //... truncated for brevity

    uint32_t exitIndex = vm.osrExitIndex;
    OSRExit& exit = codeBlock->jitCode()->dfg()->osrExit[exitIndex];

   //... truncated for brevity

    // Compute the value recoveries.
    Operands<ValueRecovery> operands;
    codeBlock->jitCode()->dfg()->variableEventStream.reconstruct(codeBlock, exit.m_codeOrigin, codeBlock->jitCode()->dfg()->minifiedDFG, exit.m_streamIndex, operands);

    SpeculationRecovery* recovery = nullptr;
    if (exit.m_recoveryIndex != UINT_MAX)
        recovery = &codeBlock->jitCode()->dfg()->speculationRecovery[exit.m_recoveryIndex];

    {
        CCallHelpers jit(codeBlock);

        //... truncated for brevity

        jit.addPtr(
            CCallHelpers::TrustedImm32(codeBlock->stackPointerOffset() * sizeof(Register)),
            GPRInfo::callFrameRegister, CCallHelpers::stackPointerRegister);

        //... truncated for brevity

        OSRExit::compileExit(jit, vm, exit, operands, recovery);

        LinkBuffer patchBuffer(jit, codeBlock);
        exit.m_code = FINALIZE_CODE_IF(
            shouldDumpDisassembly() || Options::verboseOSR() || Options::verboseDFGOSRExit(),
            patchBuffer, OSRExitPtrTag,
            "DFG OSR exit #%u (D@%u, %s, %s) from %s, with operands = %s",
                exitIndex, exit.m_dfgNodeIndex, toCString(exit.m_codeOrigin).data(),
                exitKindToString(exit.m_kind), toCString(*codeBlock).data(),
                toCString(ignoringContext<DumpContext>(operands)).data());
    }

    MacroAssembler::repatchJump(exit.codeLocationForRepatch(), CodeLocationLabel<OSRExitPtrTag>(exit.m_code.code()));

    vm.osrExitJumpDestination = exit.m_code.code().executableAddress();
}
This function performs three main actions:
- It recovers register/operand values to reconstruct the call frame for the Baseline JIT.
- Generates machine code for the OSR Exit.
- Sets a OSR Exit jump destination, which is the start of the machine code generated in #2.
One can add the --verboseDFGOSRExit=true flag to launch.json or the command line would print the generated OSR Exit code to stdout:
Generated JIT code for DFG OSR exit #0 (D@0, bc#0, BadType) from jitMe#Dsl1pz:[0x7fffae3c4260->0x7fffae3c4130->0x7fffae3e5100, DFGFunctionCall, 15 (DidTryToEnterInLoop)], with operands = arg2:*arg2 arg1:*arg1 arg0:*this loc0:*loc0 loc1:*loc1 loc2:*loc2 loc3:*loc3 loc4:*loc4 loc5:*loc5 loc6:*loc6 loc7:*loc7:
    Code at [0x7fffeecfe3a0, 0x7fffeecfe880):
      0x7fffeecfe3a0: lea -0x40(%rbp), %rsp
      0x7fffeecfe3a4: test $0x7, %bpl
      0x7fffeecfe3a8: jz 0x7fffeecfe3b5
      0x7fffeecfe3ae: mov $0xa, %r11d
      0x7fffeecfe3b4: int3
      0x7fffeecfe3b5: mov $0x7fffeedfac28, %r11
      0x7fffeecfe3bf: inc (%r11)
      0x7fffeecfe3c2: mov $0xfffe000000000000, %r11
      0x7fffeecfe3cc: cmp %r11, %r14
      0x7fffeecfe3cf: jz 0x7fffeecfe3dd
      //... truncated for brevity
Execution now jumps to 0x7fffeecfe3a0 which is the start of the JIT code for OSR Exit at the end of which execution of the function call completes in the Baseline JIT. A useful JSC command line flag to that let’s trace OSR Exits is --printEachOSRExit. Adding this flag prints details of each OSR Exit that occurs from optimised code. An example of this from the test script above is shown below:
Speculation failure in jitMe#Dsl1pz:[0x7fffae3c4260->0x7fffae3c4130->0x7fffae3e5100, DFGFunctionCall, 15 (DidTryToEnterInLoop)] @ exit #0 (bc#0, BadType) with executeCounter = 0.000000/1072.000000, -1000, reoptimizationRetryCounter = 0, optimizationDelayCounter = 0, osrExitCounter = 0
    GPRs at time of exit: rax:0x7fffeecfe880 rsi:0x7fffffffc9a0 rdx:(nil) rcx:0x4 r8:(nil) r10:0x7ffff5e1d32b rdi:0x7fffffffc970 r9:0x7fffffffc9f0 rbx:0xeeda7a00 r12:0x7fffeeda0250 r13:0x7fffeedabe10
    FPRs at time of exit: xmm0:41d800b5832e41dd:1610798604.722770 xmm1:41d800b583000000:1610798604.000000 xmm2:412e848000000000:1000000.000000 xmm3:3630633030646561:0.000000 xmm4:2020202020202020:0.000000 xmm5:3365616666663778:0.000000
The snippet above indicates the reason for OSR Exit (in this case BadType), the bytecode at which the OSR Exit occurred (exit at #0 to bc#0) and the number of times this OSR Exit has occurred from this codeblock (indicated by the counter osrExitCounter). If the osrExitCounter exceed a certain value, the optimised code is jettisoned and future calls to the function are directed to the Baseline JIT and in some cases to the LLInt. The next section will explore how jettison occurs and how this affects recompilation.
Jettison and Recompilation
With each OSR Exit from an optimised CodeBlock, the OSR Exit counter for that CodeBlock is incremented. Once a threshold on number of exits has been breached, the optimized code is jettisoned and all future calls to the CodeBlock are executed in the Baseline JIT or the LLInt. When a function is jettisoned, the optimised code is discarded and a recompilation counter is incremented. In addition, the threshold values to tier up into the DFG from the Baseline JIT are now updated to a much larger value to allow bytecodes to execute longer in the lower tier which in turn allows the lower tier to gather more accurate profiling data before optimising the function again.
Let’s examine this by updating our test script as shown below:
function jitMe(x,y) {
    return x + y
}

let x = 1;

// Optimise jitMe using DFG
for (let y = 0; y < 1000; y++) {
    jitMe(x,y)
}


// Trigger OSR Exits
for(let y = 0; y < 100; y++){
    jitMe("a","b")
}

// Trigger jettison
jitMe("a","b")
The program above first optimises jitMe using the DFG, which is optimised to handle integer values. It then triggers several OSR Exits by supplying string values to jitMe instead of integers. This increments the OSR Exit counter but not enough to cause jettison. The final call to jitMe triggers OSR Exit and jettison. To understand how this is constructed one needs to revisit OSRExit::compileExit which is invoked when compiling the OSR Exit code that we’ve seen in th previous section. Within the function compileExit is a call to handleExitCounts which as the name suggests is responsible for counting OSR exits and triggering reoptimisation. The function handleExitCounts is defined in dfg/DFGOSRExitCompilerCommon.cpp and a truncated version of this function is listed below:
void handleExitCounts(VM& vm, CCallHelpers& jit, const OSRExitBase& exit)
{
    //... truncated for brevity

    jit.load32(AssemblyHelpers::Address(GPRInfo::regT3, CodeBlock::offsetOfOSRExitCounter()), GPRInfo::regT2);
    jit.add32(AssemblyHelpers::TrustedImm32(1), GPRInfo::regT2);
    jit.store32(GPRInfo::regT2, AssemblyHelpers::Address(GPRInfo::regT3, CodeBlock::offsetOfOSRExitCounter()));

    //... truncated for brevity

    jit.move(
        AssemblyHelpers::TrustedImm32(jit.codeBlock()->exitCountThresholdForReoptimization()),
        GPRInfo::regT1);

    //... truncated for brevity

    tooFewFails = jit.branch32(AssemblyHelpers::BelowOrEqual, GPRInfo::regT2, GPRInfo::regT1);

    //... truncated for brevity

    jit.setupArguments<decltype(operationTriggerReoptimizationNow)>(GPRInfo::regT0, GPRInfo::regT3, AssemblyHelpers::TrustedImmPtr(&exit));
    jit.prepareCallOperation(vm);
    jit.move(AssemblyHelpers::TrustedImmPtr(tagCFunction<OperationPtrTag>(operationTriggerReoptimizationNow)), GPRInfo::nonArgGPR0);
    jit.call(GPRInfo::nonArgGPR0, OperationPtrTag);
    AssemblyHelpers::Jump doneAdjusting = jit.jump();

    tooFewFails.link(&jit);

    // Adjust the execution counter such that the target is to only optimize after a while.
    //... truncated for brevity
}
In the snippet above, the function begins by emitting code that first gets a reference to the osrExitCounter for the CodeBlock and increments it by one which is stored in a temporary register regT2. Next the value of the exit count threshold for reoptimisation is then stored to a temporary register regT1. A branching instruction is emitted which checks if the OSR exit count for the CodeBlock is greater than that of the threshold count, then calls the JIT operation operationTriggerReoptimizationNow. Let’s now run the test script in our debugger and set a breakpoint at triggerReoptimizationNow which is invoked by operationTriggerReoptimizationNow:
void triggerReoptimizationNow(CodeBlock* codeBlock, CodeBlock* optimizedCodeBlock, OSRExitBase* exit)
{
    //... truncated for brevity

    // In order to trigger reoptimization, one of two things must have happened:
    // 1) We exited more than some number of times.
    // 2) We exited and got stuck in a loop, and now we're exiting again.
    bool didExitABunch = optimizedCodeBlock->shouldReoptimizeNow();
    bool didGetStuckInLoop =
        (codeBlock->checkIfOptimizationThresholdReached() || didTryToEnterIntoInlinedLoops)
        && optimizedCodeBlock->shouldReoptimizeFromLoopNow();

    if (!didExitABunch && !didGetStuckInLoop) {
        dataLogLnIf(Options::verboseOSR(), *codeBlock, ": Not reoptimizing ", *optimizedCodeBlock, " because it either didn't exit enough or didn't loop enough after exit.");
        codeBlock->optimizeAfterLongWarmUp();
        return;
    }

    optimizedCodeBlock->jettison(Profiler::JettisonDueToOSRExit, CountReoptimization);
}
If the two conditions listed above (i.e. several OSR Exits and getting stuck in a loop), the optimised code is jettisoned with the call to CodeBlock::jettison:
void CodeBlock::jettison(Profiler::JettisonReason reason, ReoptimizationMode mode, const FireDetail* detail)
{

    //... code truncated for brevity

    // We want to accomplish two things here:
    // 1) Make sure that if this CodeBlock is on the stack right now, then if we return to it
    //    we should OSR exit at the top of the next bytecode instruction after the return.
    // 2) Make sure that if we call the owner executable, then we shouldn't call this CodeBlock.

#if ENABLE(DFG_JIT)
    if (JITCode::isOptimizingJIT(jitType()))
        jitCode()->dfgCommon()->clearWatchpoints();

    if (reason != Profiler::JettisonDueToOldAge) {
        Profiler::Compilation* compilation = jitCode()->dfgCommon()->compilation.get();
        if (UNLIKELY(compilation))
            compilation->setJettisonReason(reason, detail);

        // This accomplishes (1), and does its own book-keeping about whether it has already happened.
        if (!jitCode()->dfgCommon()->invalidate()) {
            // We've already been invalidated.
            RELEASE_ASSERT(this != replacement() || (vm.heap.isCurrentThreadBusy() && !vm.heap.isMarked(ownerExecutable())));
            return;
        }
    }

    //... truncated for brevity

    if (this != replacement()) {
        // This means that we were never the entrypoint. This can happen for OSR entry code
        // blocks.
        return;
    }

    if (alternative())
        alternative()->optimizeAfterWarmUp();

    //... code truncated for brevity

    // This accomplishes (2).
    ownerExecutable()->installCode(vm, alternative(), codeType(), specializationKind());
}
The function first determines the reason for jettison (in this is case it’s due to OSR Exits) and then invalidates the optimised code generated by the DFG. It ensures that the CodeBlock is on the stack and finally calls installCode to install the Baseline JIT code. Enabling the flags dumpDFGDisassembly and verboseOSR on the command line prints information on the reason for jettison and tier code that future function calls will execute:
jitMe#Dsl1pz:[0x7fffae3c4130->0x7fffae3e5100, BaselineFunctionCall, 15 (DidTryToEnterInLoop) (FTLFail)]: Entered reoptimize
Jettisoning jitMe#Dsl1pz:[0x7fffae3c4260->0x7fffae3c4130->0x7fffae3e5100, DFGFunctionCall, 15 (DidTryToEnterInLoop)] and counting reoptimization due to OSRExit.
    Did invalidate jitMe#Dsl1pz:[0x7fffae3c4260->0x7fffae3c4130->0x7fffae3e5100, DFGFunctionCall, 15 (DidTryToEnterInLoop)]
    Did count reoptimization for jitMe#Dsl1pz:[0x7fffae3c4260->0x7fffae3c4130->0x7fffae3e5100, DFGFunctionCall, 15 (DidTryToEnterInLoop)]
jitMe#Dsl1pz:[0x7fffae3c4130->0x7fffae3e5100, BaselineFunctionCall, 15 (DidTryToEnterInLoop) (FTLFail)]: Optimizing after warm-up.
jitMe#Dsl1pz:[0x7fffae3c4130->0x7fffae3e5100, BaselineFunctionCall, 15 (DidTryToEnterInLoop) (FTLFail)]: bytecode cost is 15.000000, scaling execution counter by 1.072115 * 1
Installing jitMe#Dsl1pz:[0x7fffae3c4130->0x7fffae3e5100, BaselineFunctionCall, 15 (DidTryToEnterInLoop) (FTLFail)]
    Did install baseline version of jitMe#Dsl1pz:[0x7fffae3c4260->0x7fffae3c4130->0x7fffae3e5100, DFGFunctionCall, 15 (DidTryToEnterInLoop)]
Once jettisoned, the bytecode will continue to run in the Baseline JIT until it tiers-up again into the DFG. The tier-up mechanism is similar to what we’ve discussed at the start of this blog post. The main difference however is the updated tier-up threshold counts that need to be reached in order to trigger re-optimisation.
Conclusion
This post explored the components that make up the DFG JIT tier in JavaScriptCore by understanding how the optimised graph is lowered to optimised machine code. The post also covered how execution transitions from the Baseline JIT to the DFG via OSR Entry and transitions from the DFG to a lower tier via OSR Exits which are causes due to failing speculation checks. This concludes our discussion on the DFG JIT.
Part VI of this blog series will dive into the details of the FTL (Faster Than Light) JIT engine the final execution tier in JavaScriptCore. The post will explore how the DFG tiers-up into the FTL, how the DFG IR is further optimised by this tier and transformed to additional FTL specific IRs, some of the key optimisation phases of the FTL and finally OSR Entry and Exit to and from this final tier.
As always, thank you for reading and if you have questions do reach out to the author @amarekano or @Zon8Research on Twitter. We would appriciate your feedback.